
A steam loss does not always trigger a clear alarm. In a combined-cycle plant, it may first appear as several small deviations distributed across water-steam cycle measurements. Taken separately, none clearly points to the equipment responsible. Together, they can reveal a sustained loss of generation.
That was the situation on a CCGT steam cycle. The site suspected losses around the steam turbine, but could not locate their source or estimate their severity with enough confidence to decide on an intervention. The analysis identified a signature consistent with a likely passing high-pressure bypass valve, with an estimated impact of approximately 1 MW.
A valve that serves a purpose, until it passes steam
The HP bypass valve has an essential role. When operating conditions require it, the valve routes steam around the turbine. But if flow passes through when the valve should be tight, part of the available energy no longer performs useful work in the turbine.
Detecting a passing valve requires correlating several measurements. Its effects include lower temperature and pressure at the turbine inlet, higher temperature at the outlet, and deviations across other steam-cycle measurements.
Faced with these distributed signals, the team needed to answer two practical questions. Was the observed pattern consistent with an HP bypass leak? And if so, how urgently should maintenance be prioritized?
Turning weak deviations into an actionable hypothesis
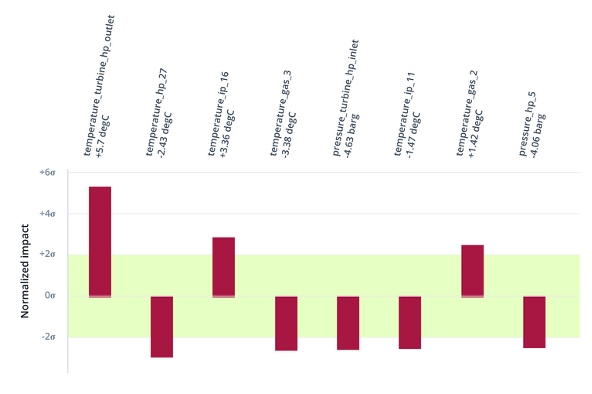
The Metroscope diagnostic did not rely on a single measurement. It connected deviations from several water-steam cycle sensors and compared them with the expected fault signature of an HP bypass leak.
The result was consistent with this mechanism:
- lower temperature and pressure at the turbine inlet;
- higher temperature at the turbine outlet;
- aligned deviations across several measurements in the steam-turbine area.
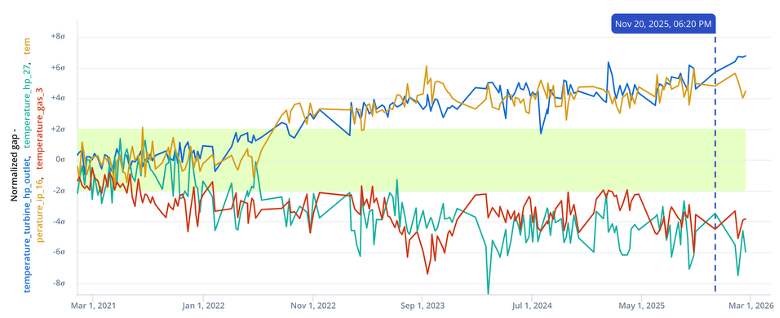
Having this combined view matters in an investigation. A slightly abnormal temperature can have many causes: instrumentation, operating conditions, control behavior, or an equipment issue. Several deviations moving in the direction expected from the same mechanism provide a stronger hypothesis for the site team to validate in the field.
Quantifying the stakes before scheduling an outage
Identifying a likely cause is not enough to determine an action. Site teams also need to understand the cost of the anomaly and whether its trajectory warrants immediate intervention, repair during a planned outage, or enhanced monitoring.
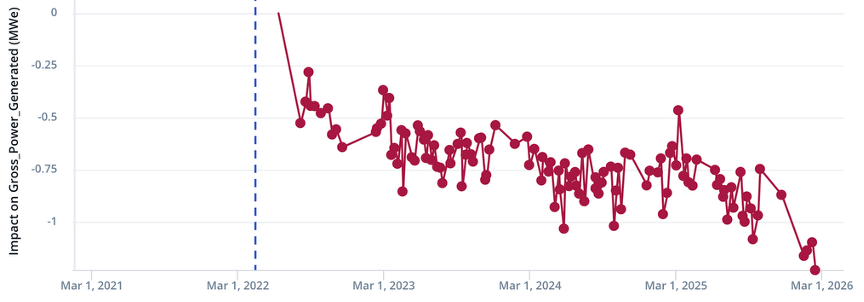
The analysis estimated an impact of approximately 1 MW, sustained for ten consecutive months. This quantified loss gave the team a basis to discuss urgency, intervention scope, and the trade-off between lost production and asset availability. The impact view showed a gradual change over time and prompted action.
The quantified impact and observed trend informed the maintenance decision. Field validation confirmed the suspected valve issue. Following the repair, the lost megawatts were recovered.
From alarms to a shared maintenance decision
The investigation gave operations, performance, and maintenance teams one coherent story: weak signals appeared, their combination matched a known fault signature, the impact was estimated, and the trend helped determine when to act.
This approach helps plants:
- make a loss visible when conventional monitoring does not readily connect it to one piece of equipment;
- quantify severity in MW to inform planning;
- track the drift so that maintenance decisions reflect risk and the anomaly's actual evolution.
In CCGTs, connecting symptoms across the combined cycle can turn a diffuse anomaly into a better-supported maintenance decision.
Are you seeing difficult-to-interpret deviations around your steam turbine? Speak with Metroscope to explore whether a multi-signal view could help your team connect them to a likely mechanism and quantify what is at stake.
