A hot start should be a routine operation. The sequence is well known. Gas turbine starts and synchronizes. Steam is produced progressively, then steam is directed toward the steam turbine and it synchronizes. The process is supported by control logic designed to protect equipment as temperatures and pressures rise and it’s almost all automatic.
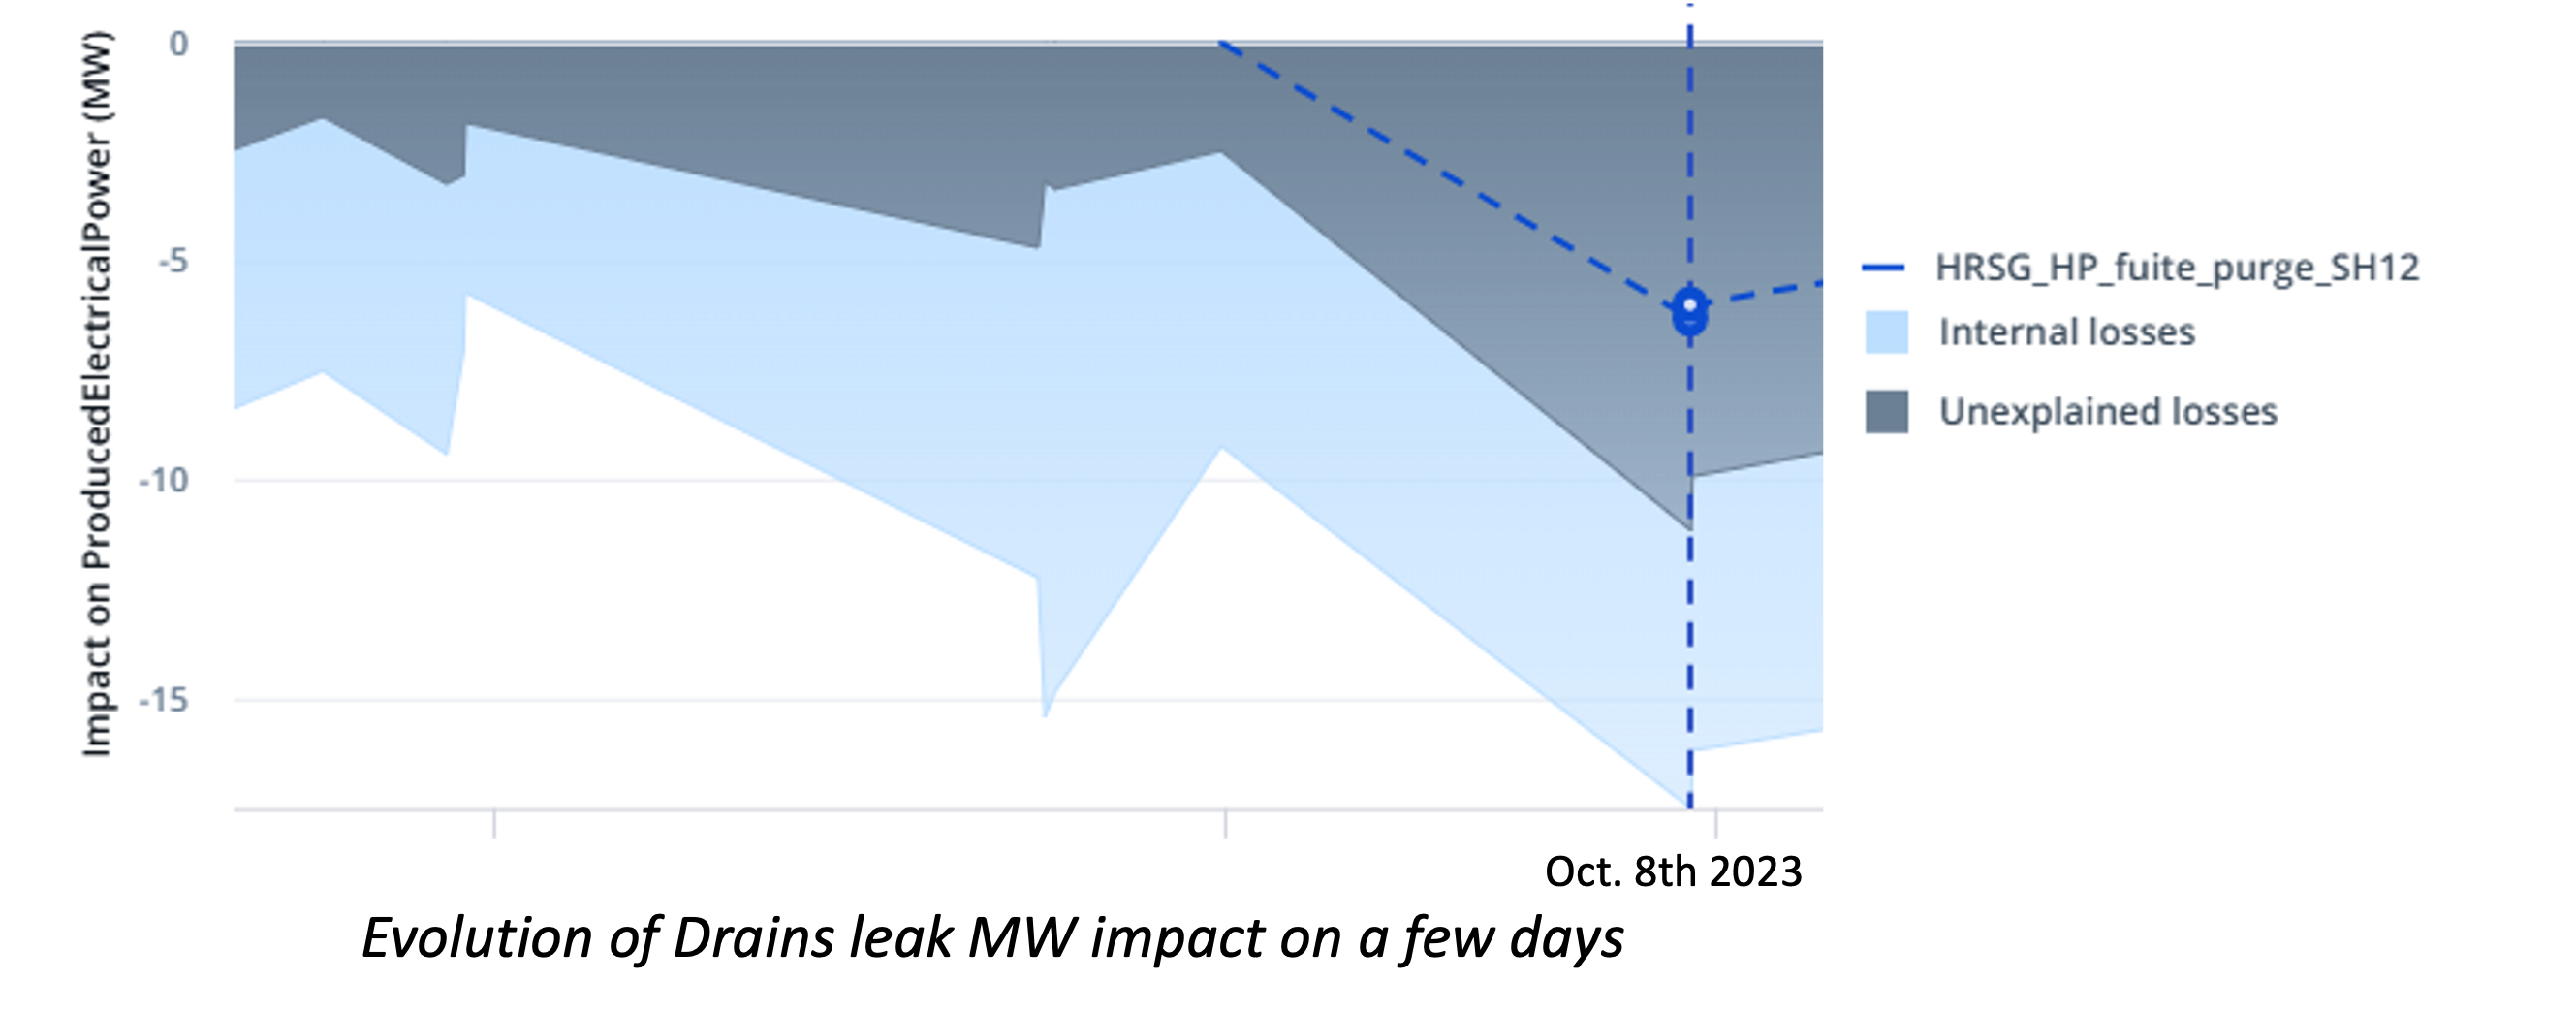
But after one such start-up, a combined-cycle plant began losing around 6 MWe. The loss have been detected by the Diagnostics module and associated to HP drain valve leak. But the reason behind and the exact location were not known.
For plants operating more flexibly, cycling, frequent starts and load variations create conditions in which failures can emerge during a transient, then leave only indirect symptoms once the plant is back at load. Conventional performance monitoring remains highly effective in quasi-steady conditions, but it cannot always reconstruct the sequence that created an issue in the first place and be specific on the location.
A loss with no obvious valve to inspect
The initial diagnostic pointed to deviations in pressure and temperature around the high-pressure steam turbine. the Diagnostic module identified a loss consistent with a drain leak in the high-pressure steam line, and quantified its impact at up to 6 MWe.
The team started investigation with valuable clues. They had a measurable production loss to motivate investigation and a defined and relatively small area where to look.
Yet important questions remained. Which valve was involved? And why had the issue appeared after a start-up?
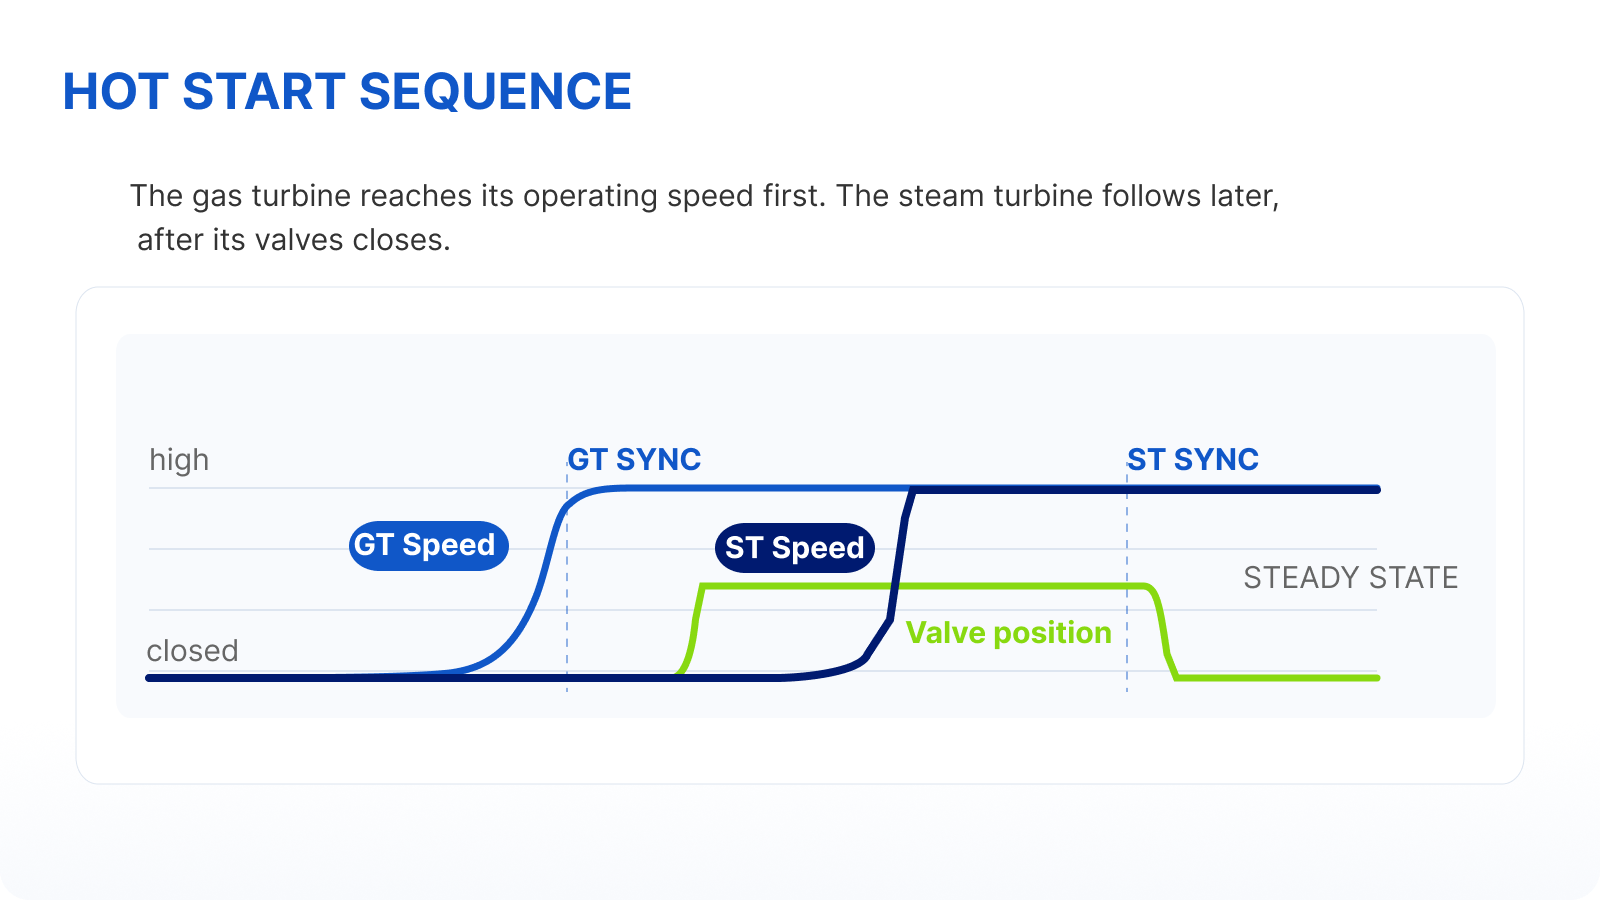
Drain valves are particularly difficult to monitor in this context. They are actively controlled during start-up, and their expected position depends on the stage of the sequence. In this case, the steam turbine drain valves should open after gas turbine synchronization, then close after steam turbine synchronization. A valve that remains open beyond that point can create performance losses, thermal stress and, in some cases, increased risk of trips.
The steady-state diagnostic could then not by itself determine which valve had behaved abnormally during the transient.
Looking back at the start-up sequence
To investigate that missing part of the story, the team used a data-driven machine learning model trained on healthy start-ups.
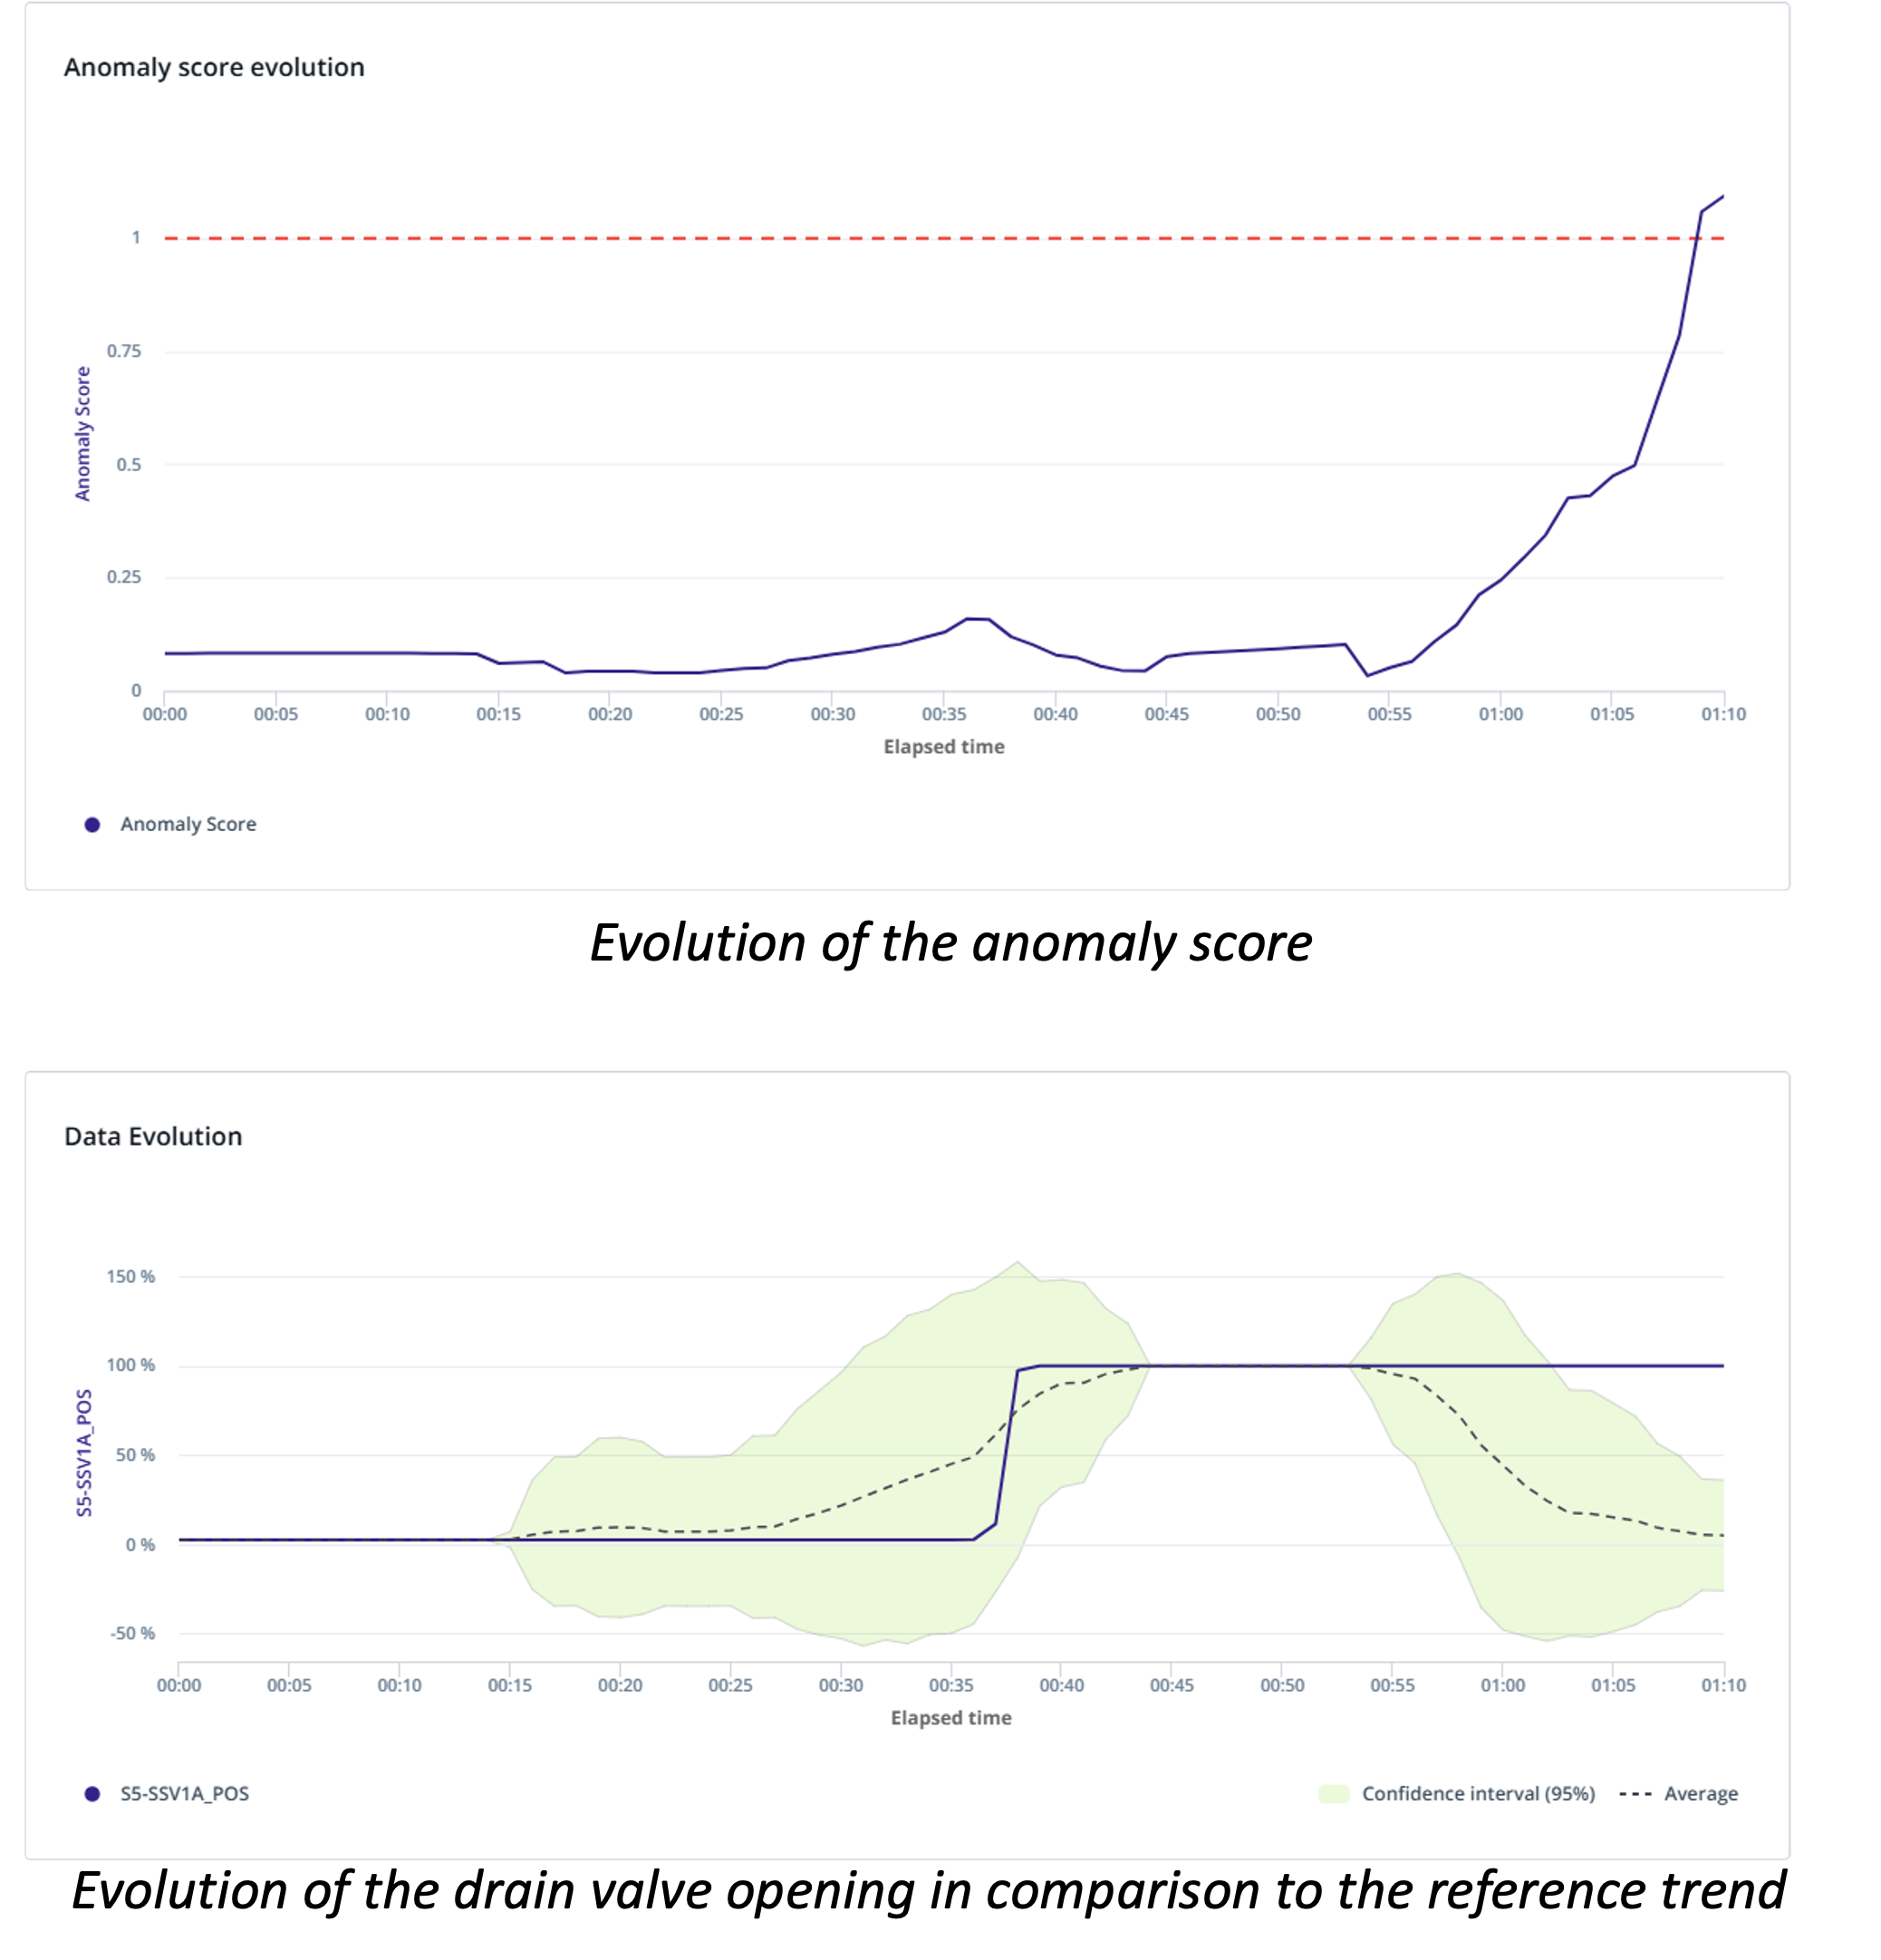
Rather than comparing the plant against a thermodynamic reference at stable load, this model compared the progression of a new start-up against the behaviour expected from previous healthy sequences. It highlighted an anomaly at the same time as the performance loss identified by the diagnostic.
The key contributors to the anomaly were the positions of several steam turbine drain valves.
Their opening behaviour did not match the healthy start-up pattern: some drain valves remained open after the point at which they should have closed. The analysis gave the site team a focused hypothesis, connecting the loss observed after the start-up with an abnormal valve sequence during it.
The data-driven approach using machine learning have been used to narrow the investigation and show where the actual start-up diverged from normal behaviour.
Together with the physics-based diagnostic, the two views turned a broad suspicion of a drain leak into an actionable investigation.
From detection to action
Operators closed the valve identified through the investigation. Performance recovered immediately. The site also planned follow-up checks on the relevant actuators and control logic to understand why the valve had remained open.
The value of the investigation was not simply that an anomaly was detected. Plant teams had alos sufficient evidence to act: a quantified loss, a fault hypothesis consistent with process measurements, and a clear deviation in the start-up sequence.
This is increasingly important as combined-cycle plants operate more frequently outside long, stable baseload periods. Monitoring strategies designed only for quasi-steady operation can miss the moments when issues are created. Conversely, transient monitoring can flag unusual behaviour without necessarily explaining its operational impact.
The two approaches answer different questions:
- Physics-based diagnostics: What is the likely performance impact, and what fault mechanism best explains it?
- Data-driven transient monitoring: When did normal behaviour change, and which measurements contributed most to that change?
Used together, they give teams visibility across the full operating cycle: from the transient that introduces an issue to the stable operation where its consequences become measurable.
For HRSGs under flexible operation, that can mean finding a six-megawatt loss before it becomes just another unexplained performance gap.
