Skip to content

Prepare every bid with reliable plant forecasts

Self-correcting forecasts of available power and heat rate that adapt to weather and plant condition.

Book a demo
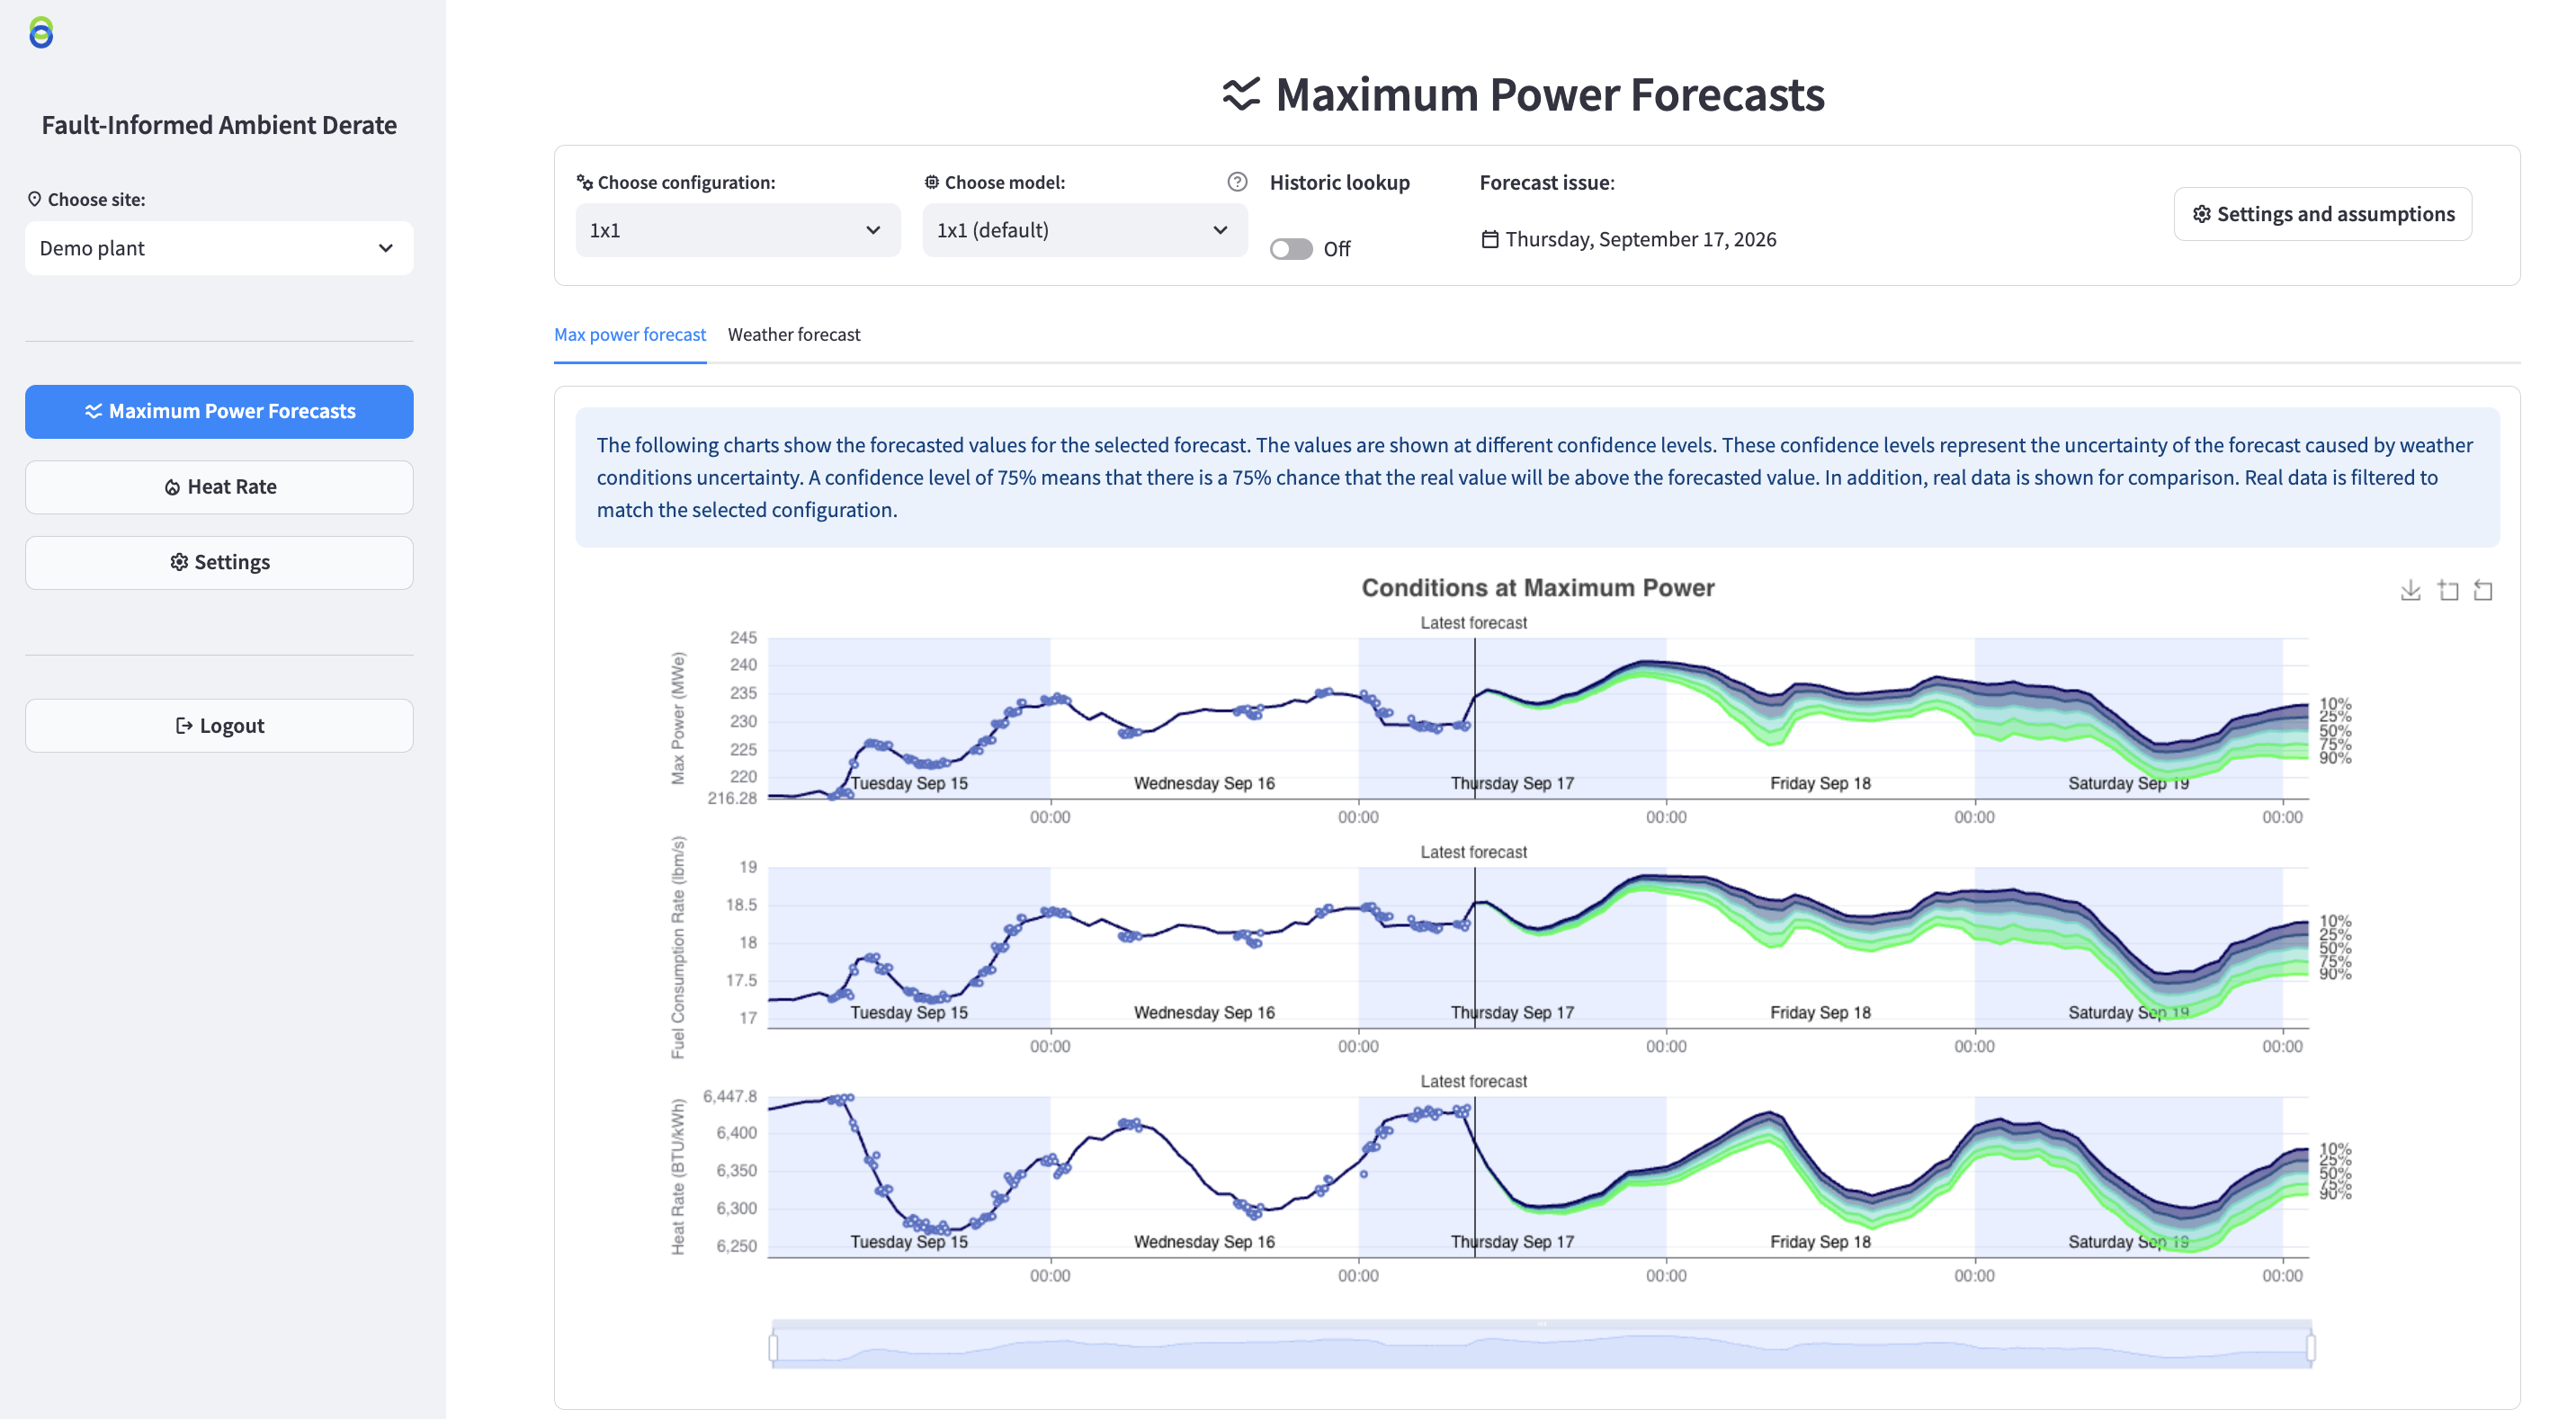
Metroscope Capacity Forecast showing historical plant performance and percentile forecasts for maximum power, fuel consumption, and heat rate.

Proven at a 1.6 GW site with 168 operating configurations.

60%
less capacity forecast error than the existing model
19 MW
closer to deliverable power for day-ahead offers
2 h/week
estimated engineering time saved

The operational challenge

Capacity forecast errors are expensive

Penalties when you overcommit, unsold capacity when you don’t.

  • Plant drift

    Performance degrades between outages, and forecasts fall behind.

  • Weather uncertainty

    A single-value forecast hides the risk.

  • Manual derates

    Set by hand, often too cautious or out of date.

  • Manual preparation

    Time-consuming, and prone to outdated inputs.

Why Metroscope

Accurate forecasts for capacity commitments

Know what your plant can reliably deliver

A continuously updated plant model combines current performance with weather forecasts and operating conditions to calculate capacity for all operating configurations.

Weather forecastsTemperature · Humidity · Pressure
Operating conditionsPlanned maintenance · House load · Cogeneration load · Condenser cooling temperature
Updated plant modelCurrent plant performance
Capacity forecast
Available powerHeat rateFuel consumption

Forecasts that stay aligned with your plant.

Kalman filtering automatically estimates and corrects model bias caused by slow, uniform drift in measurements or equipment condition, reducing the need for manual derate adjustments.

Power output

How Kalman filtering corrects gradual model biasIllustrative power output over one production day, with morning ramp-up, production plateaus and evening ramp-down. The model has a persistent bias relative to measured output. A correction for this slow bias brings the forecast closer to measurements, with residual differences. These are synthetic curves, not customer results or a demonstration of transient correction.Model biasCorrection applied
00:0006:0012:0018:0024:00
  • Measured output
  • Uncorrected model
  • Kalman-corrected forecast

Gain time and confidence with controlled automation

Forecasts run automatically, with results available as charts, shareable tables, or through API integration.

Connected inputsWeather forecastsUpdated plant modelOperating assumptions
Automatic forecast
ChartsUnderstand the results
Shareable tableSend to your teams
APIConnect your tools

Also available

Real-time capacitySee how much power the plant can generate now.
Model evaluationReview statistical measures of model performance.

Deployment options

Two ways to forecast available capacity

Standalone

Statistical forecasting

Historical plant performance helps the forecast account for existing degradation.

With Diagnostics

Physics-based forecasting

The Digital Twin and diagnostic results keep the forecast aligned with current plant conditions.

EPRI technical brief

Fault-informed forecasting, live at SRP’s Kyrene 7 plant.

Top third of the first page of EPRI’s Fault-Informed Performance Forecasting technical brief, with the EPRI identity and title.Read on the EPRI website

Other modules

Diagnostics

Where are we losing performance?

Identify simultaneous causes of power and efficiency losses and quantify their individual impact.

Power outputExpectedActualFault 1Fault 2
See module

Anomaly Detection

Which equipment needs attention first?

Monitor system reliability by detecting and investigating abnormal equipment behavior.

ExpectedActualFailure
See module

Transient Monitoring

Did the operating sequence behave as expected?

Automatically detect emerging issues during transient phases and support flexible operations.

StatisticalLimitsCurrentStart-up
See module

Bring greater confidence to your next capacity commitment