Know which transients need investigation
One multidimensional score condenses how far the full event departs from its reference. Teams can screen recurring transients quickly and decide which events justify deeper analysis.
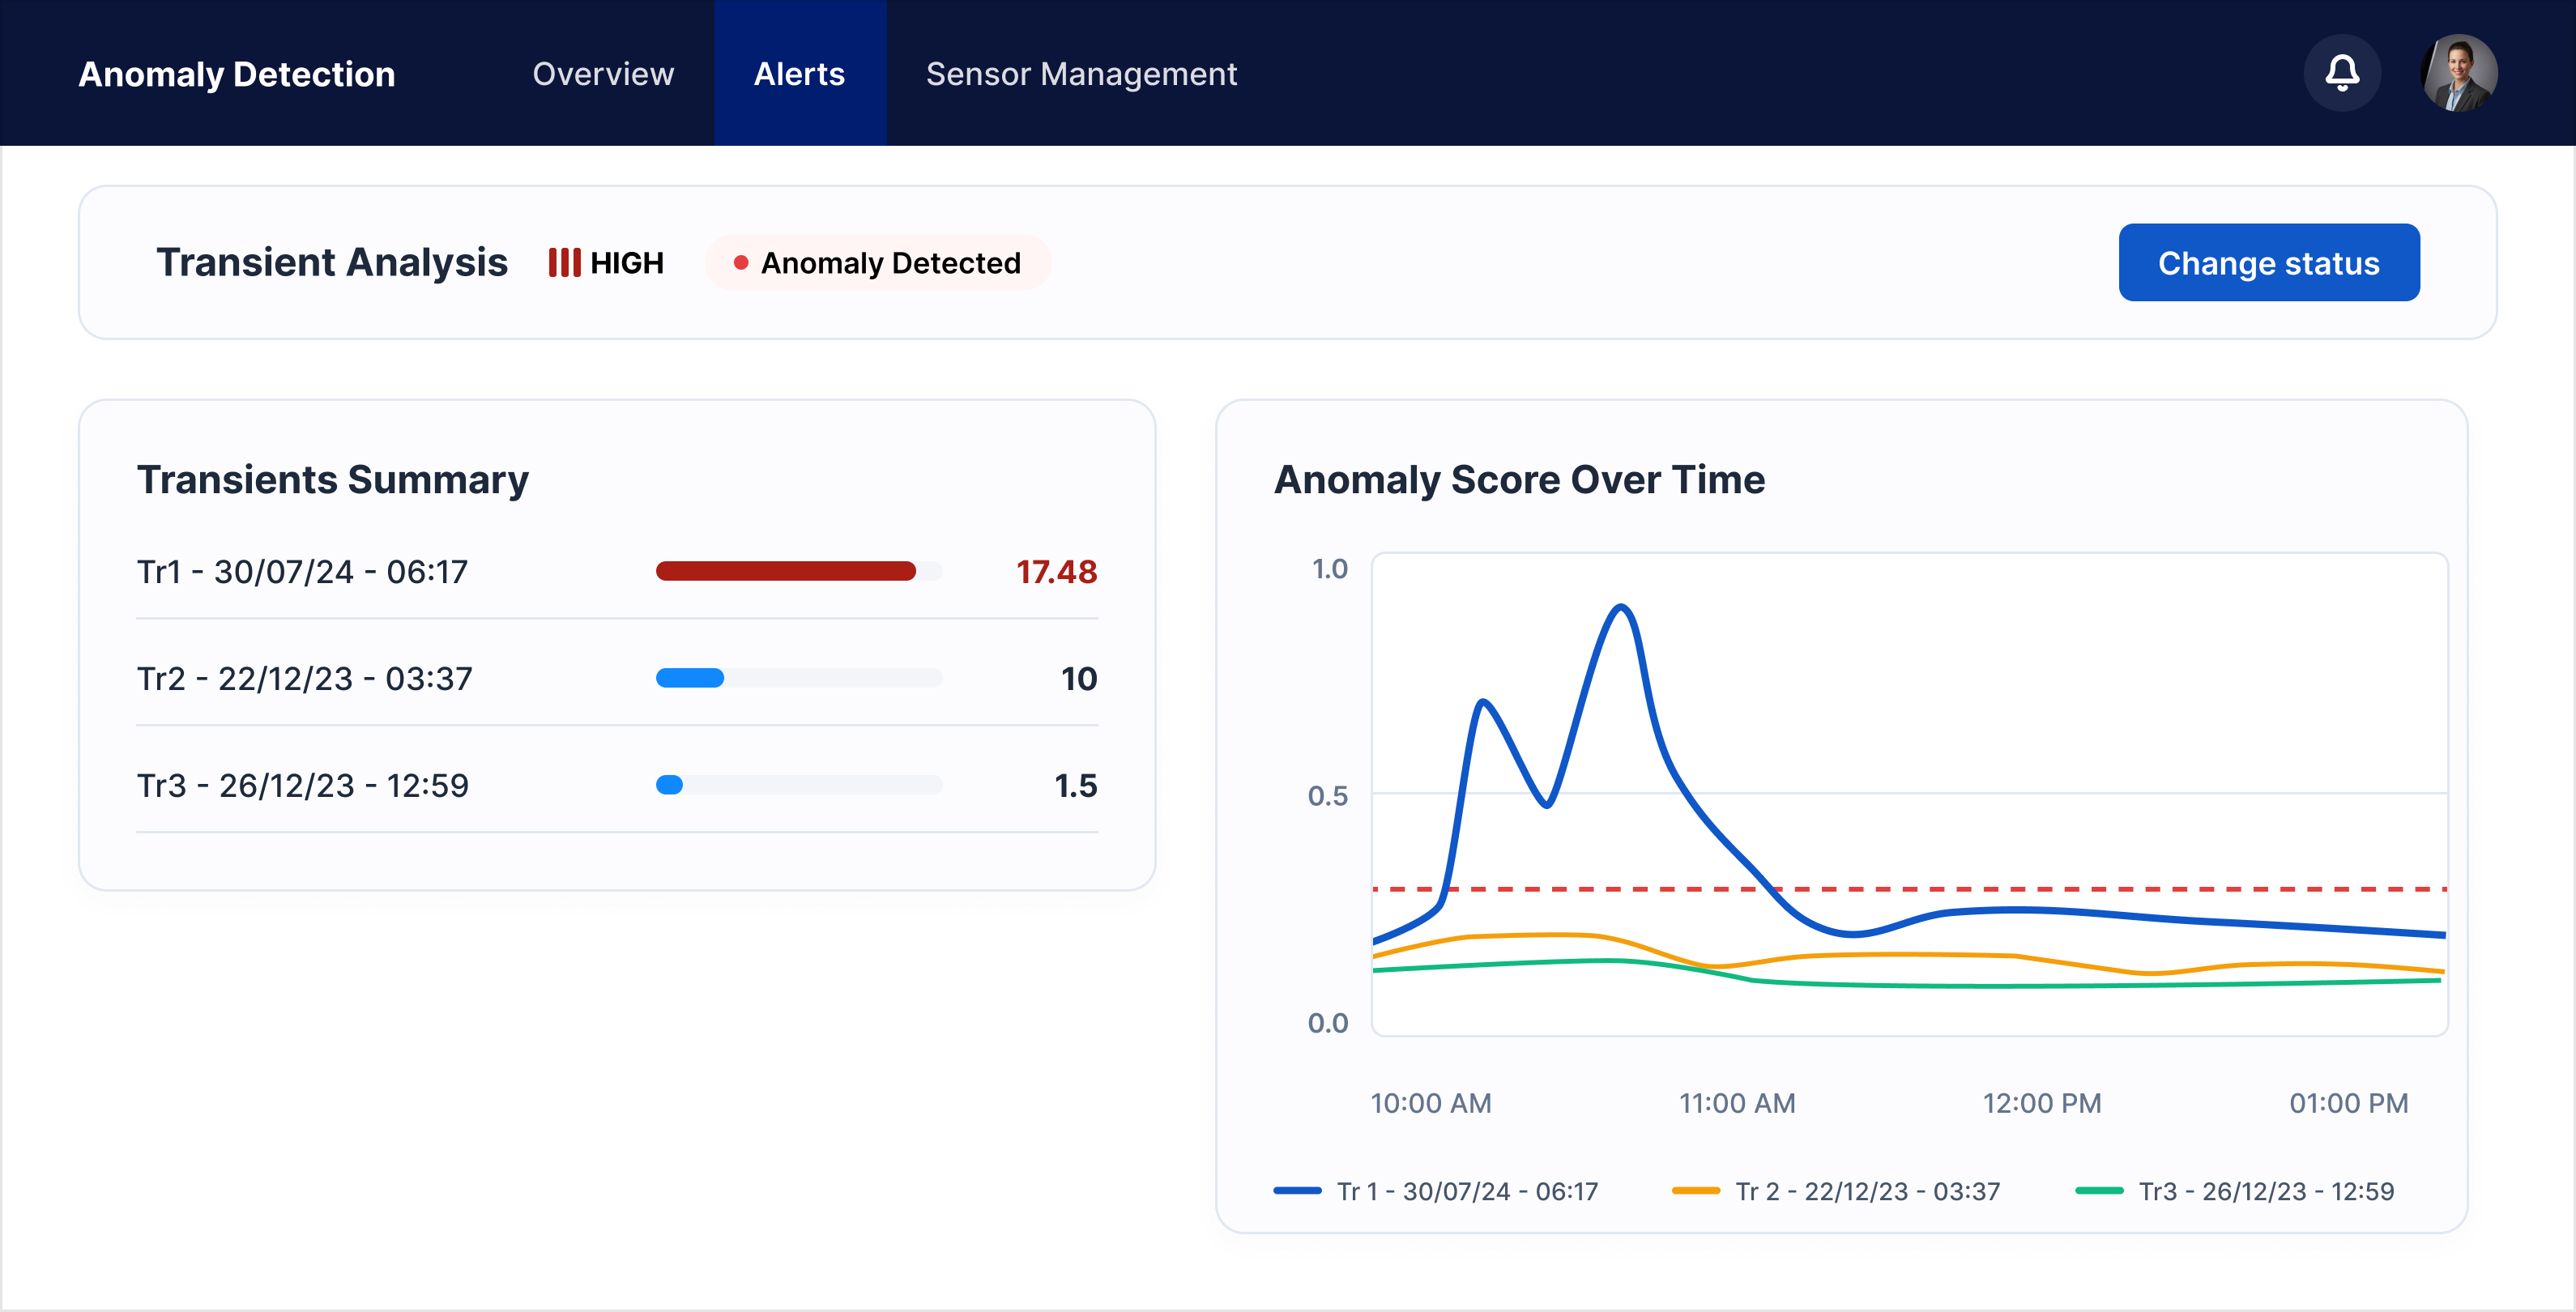
Monitor starts, stops, and load changes to identify abnormal behavior, focus investigations, and help protect plant availability.
Book a demo
The operating challenge
Flexible operation is increasing starts, stops, and load changes across nuclear and conventional fleets. Manual review cannot keep pace, so abnormal behavior can remain unexplored until an operational issue occurs.
At EDF, nuclear modulation volume and CCGT shutdowns and restarts doubled between 2019 and 2024. Source: EDF, 2026
Expected values change throughout the sequence, making abnormal behavior difficult to distinguish.
Replaying trends and comparing equivalent events takes time, specialist knowledge, and consistent historical data.
Teams often examine a transient only after a trip, start-up delay, or performance issue has made the problem visible.
Why Metroscope
Summarize the event, identify the measurements behind the deviation, and reconstruct how the sequence developed.
One multidimensional score condenses how far the full event departs from its reference. Teams can screen recurring transients quickly and decide which events justify deeper analysis.
Sensor contributions rank the measurements driving the overall deviation. Plant teams know where to begin and why those signals deserve attention.
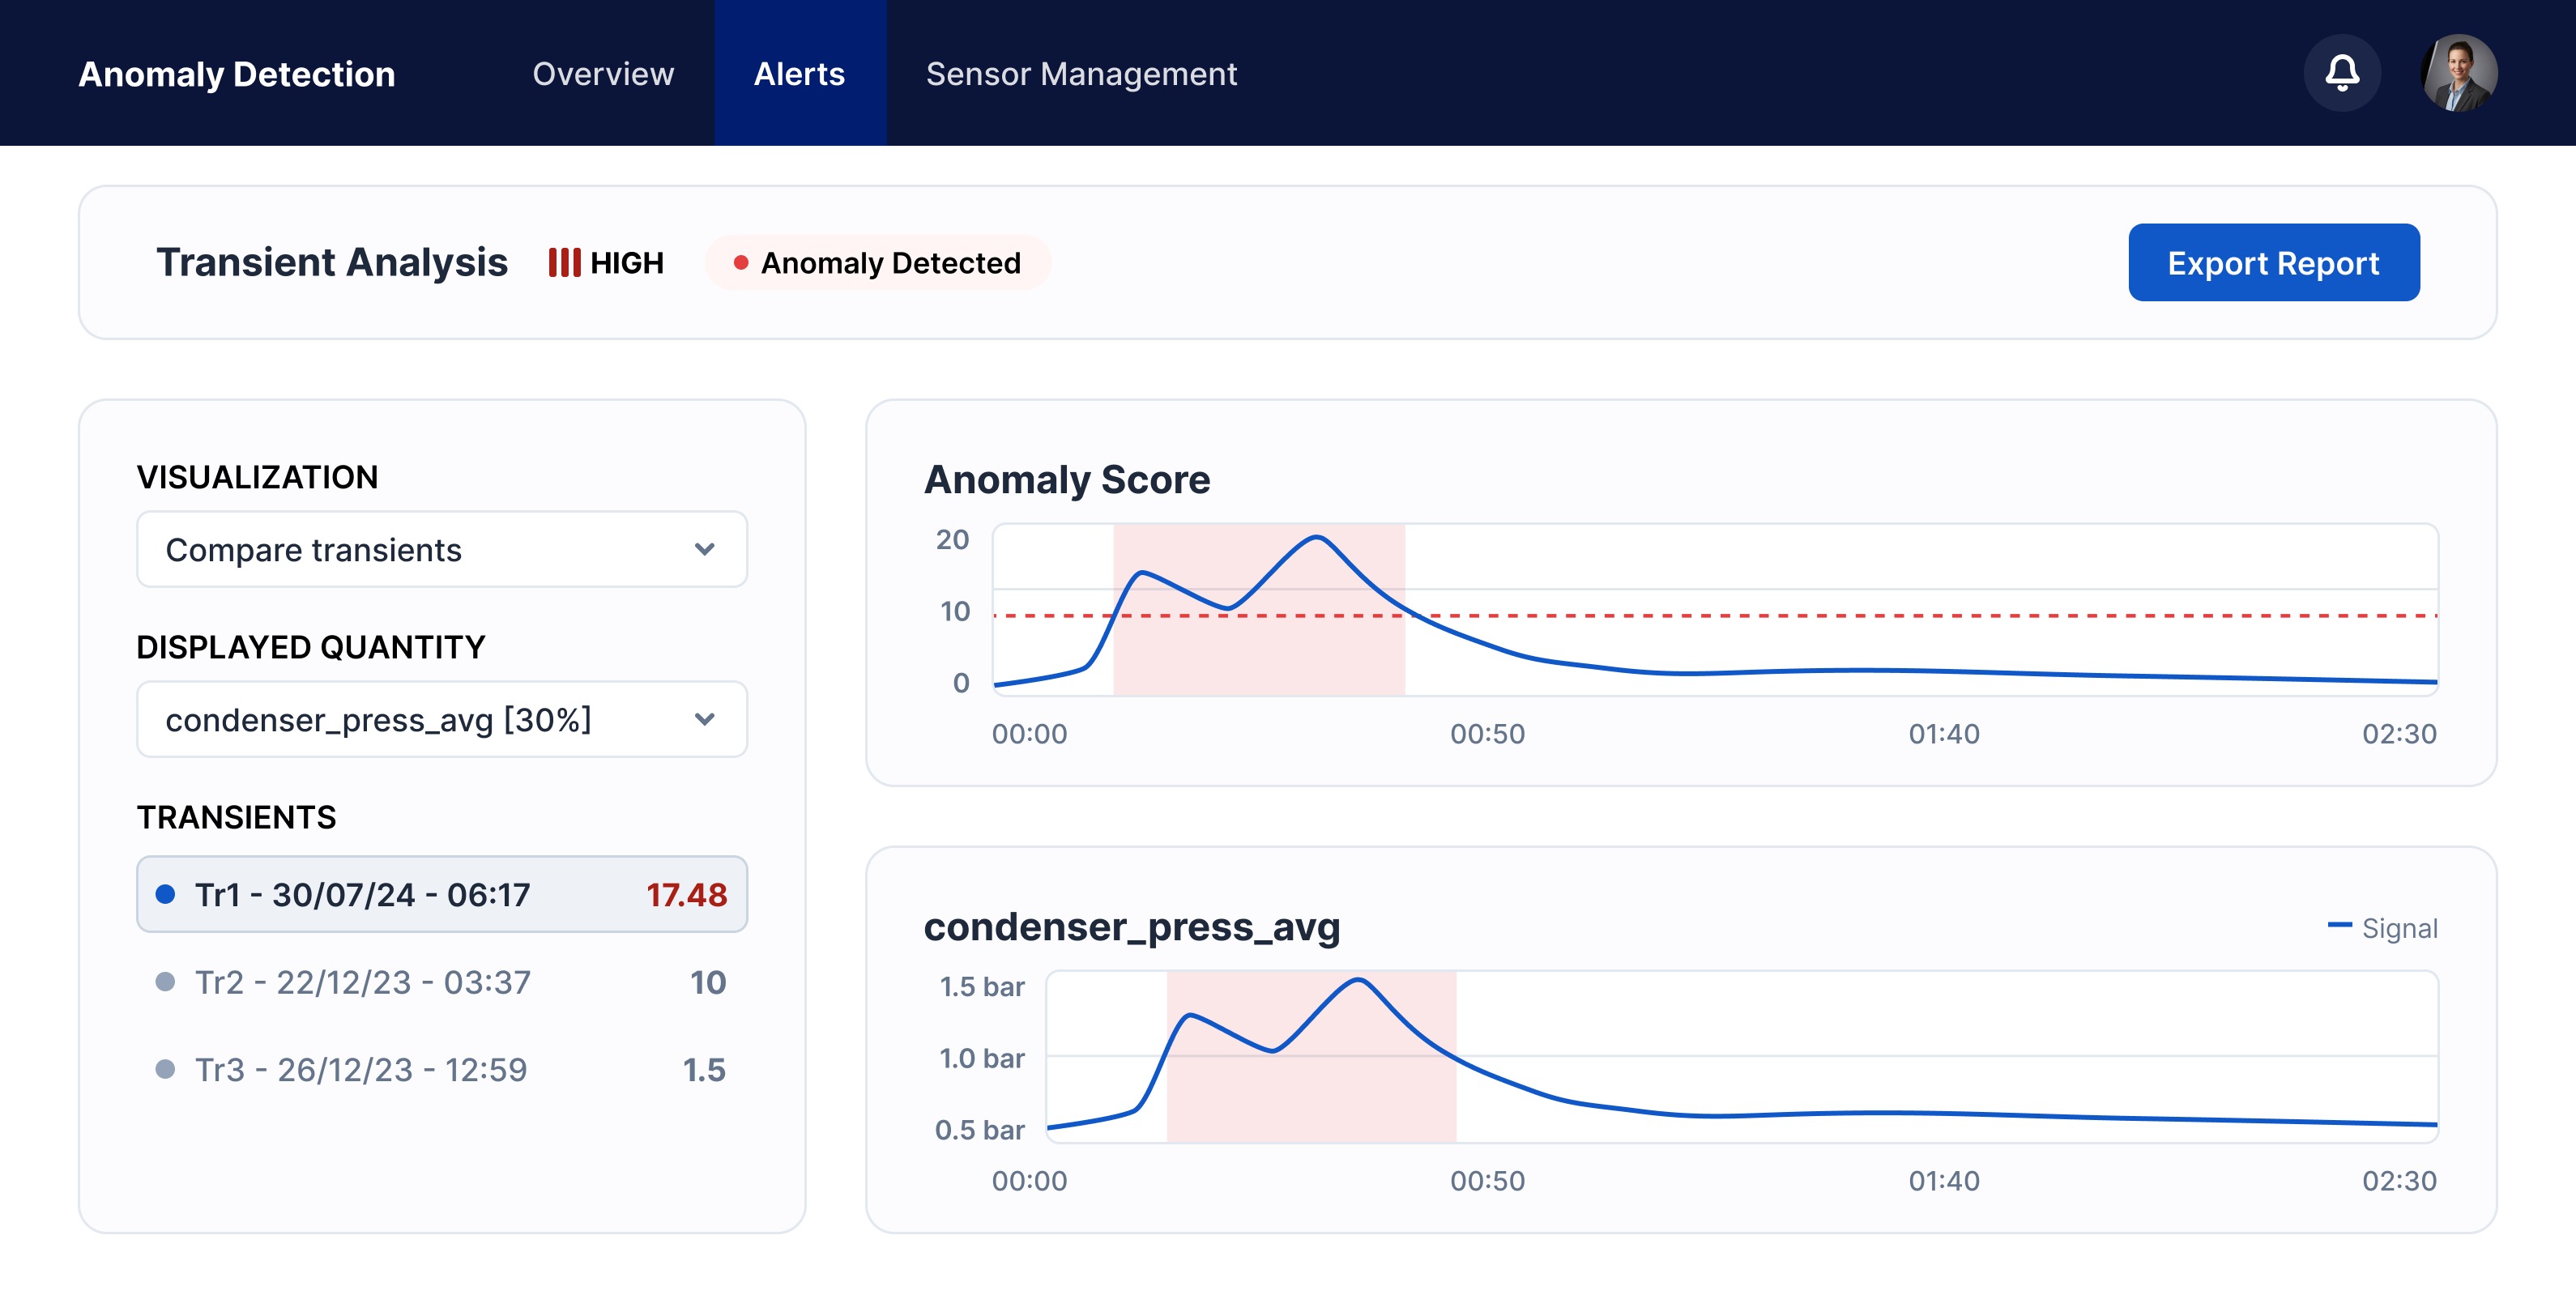
Expected ranges and multi-signal comparisons show when and how the event diverged. Teams can relate the sequence to operating conditions and other plant evidence to guide the next checks.
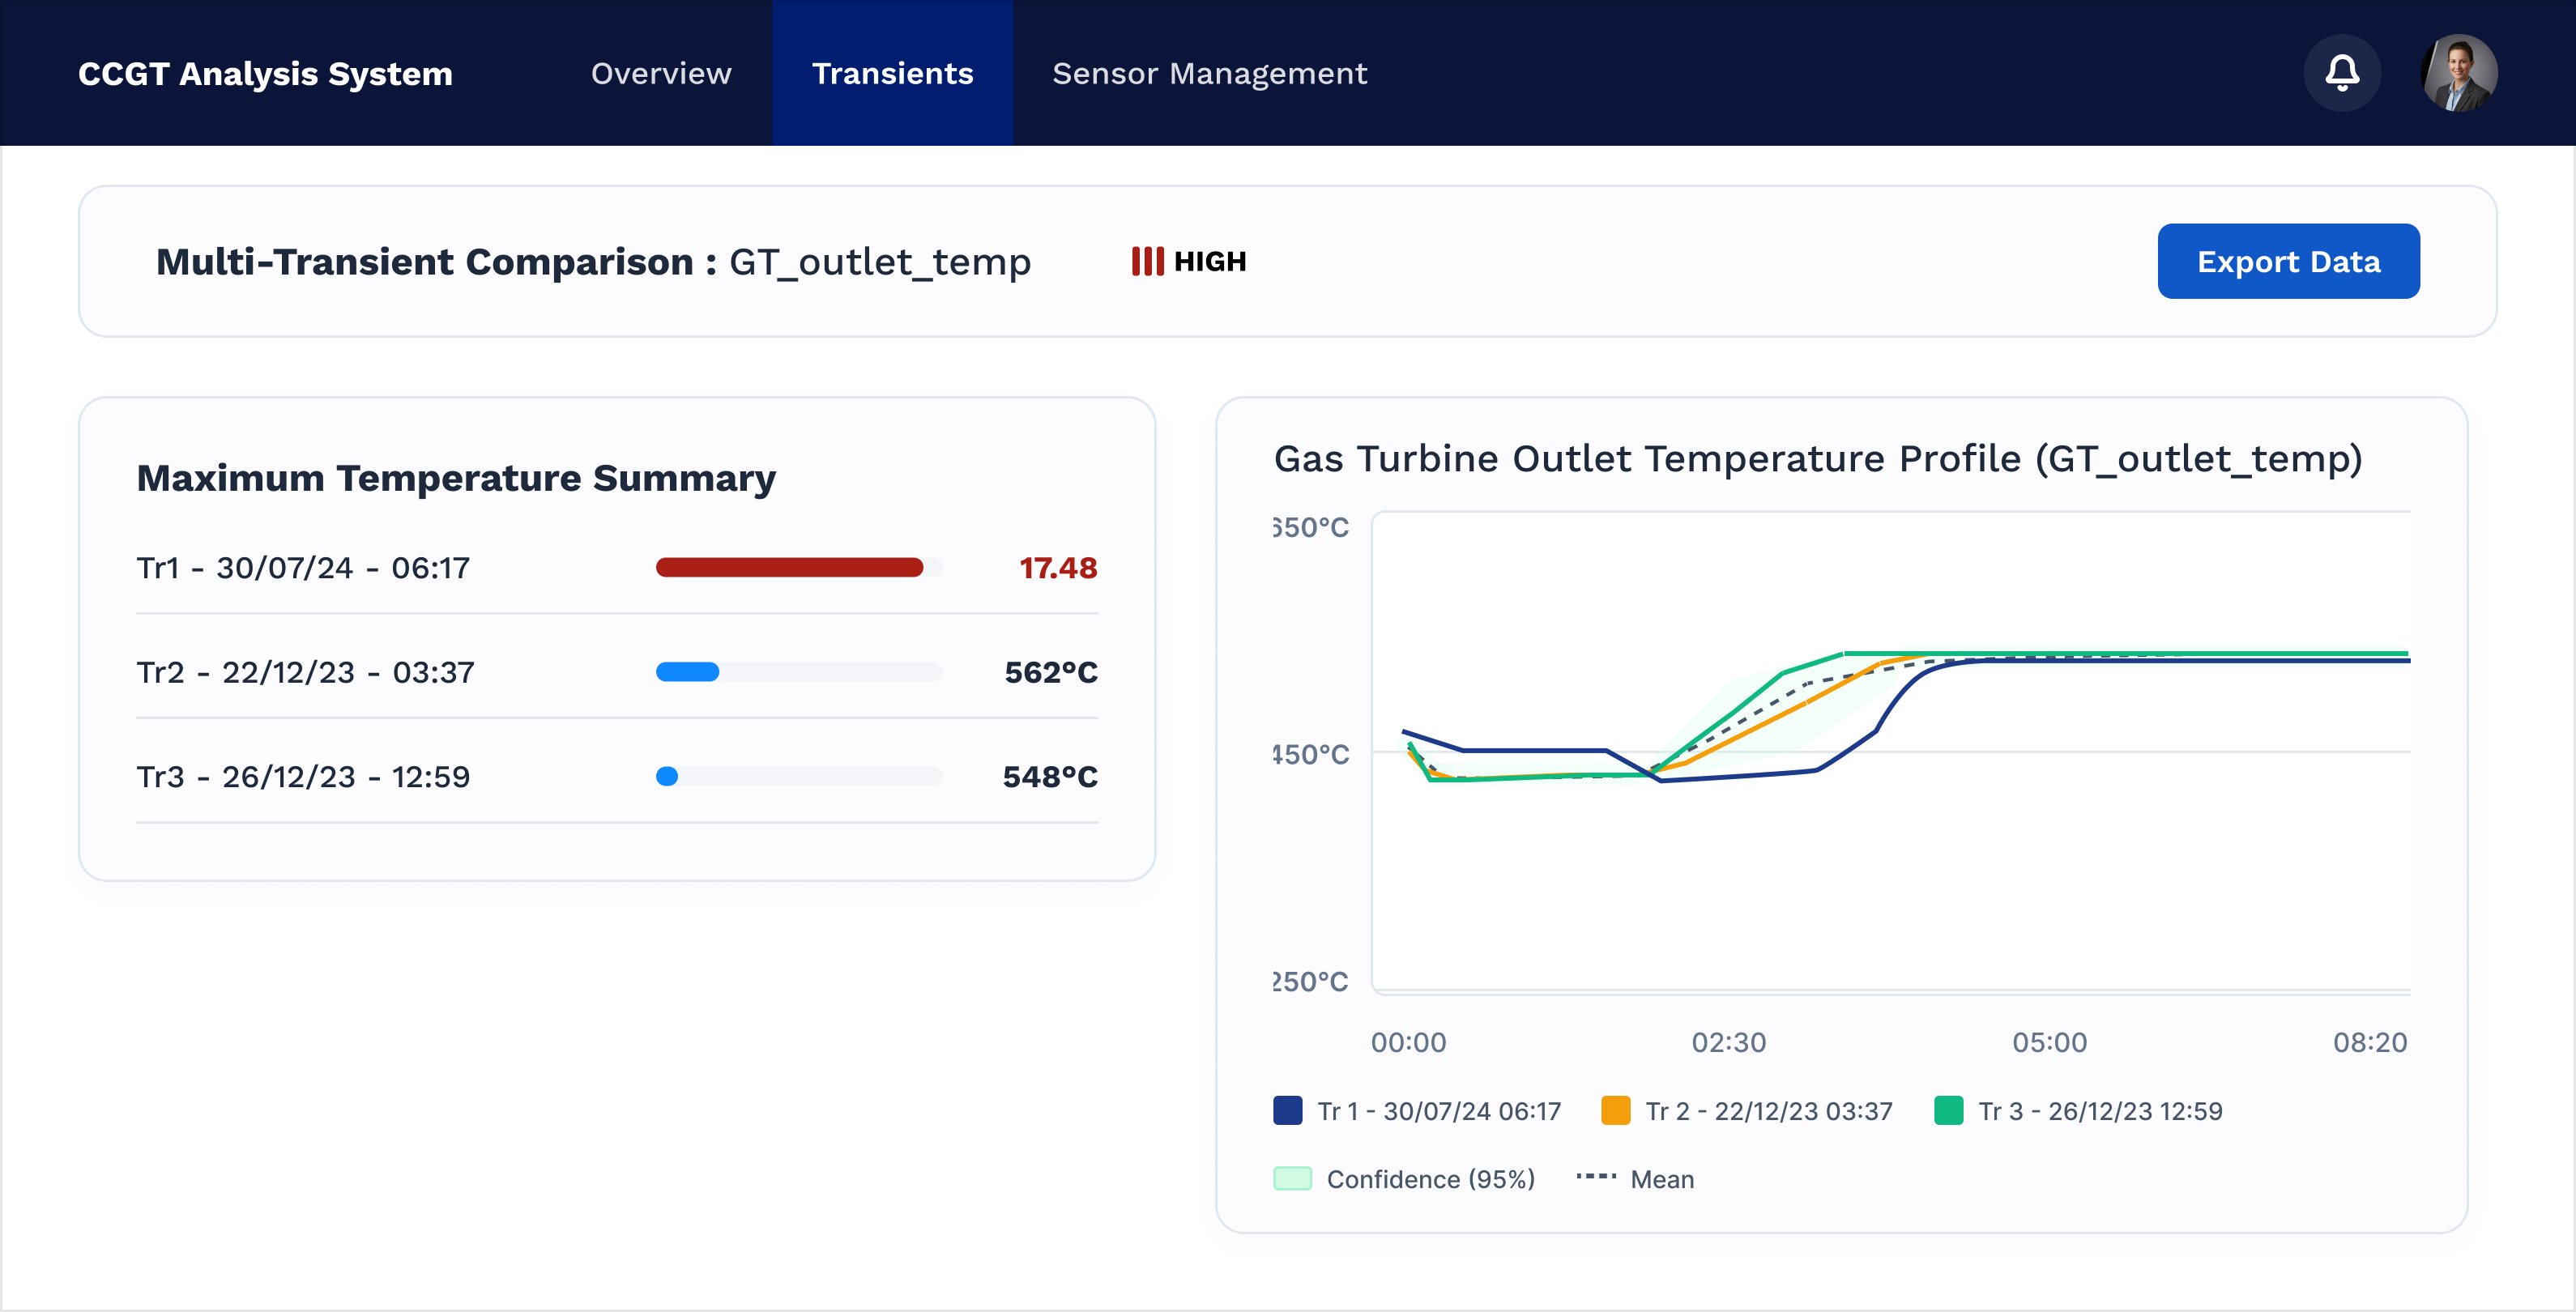
Evidence from a CCGT application
After a hot start, Diagnostics identified a loss of up to 6 MWe. Transient Monitoring then helped the team identify the drain valve involved.
Diagnostics
Identify simultaneous causes of power and efficiency losses and quantify their individual impact.
See moduleAnomaly Detection
Monitor system reliability by detecting and investigating abnormal equipment behavior.
See moduleCapacity Forecast
Forecast available power and associated heat rate based on plant and weather conditions.
See moduleExplore how Transient Monitoring can support your plant’s investigations