See where performance is lost
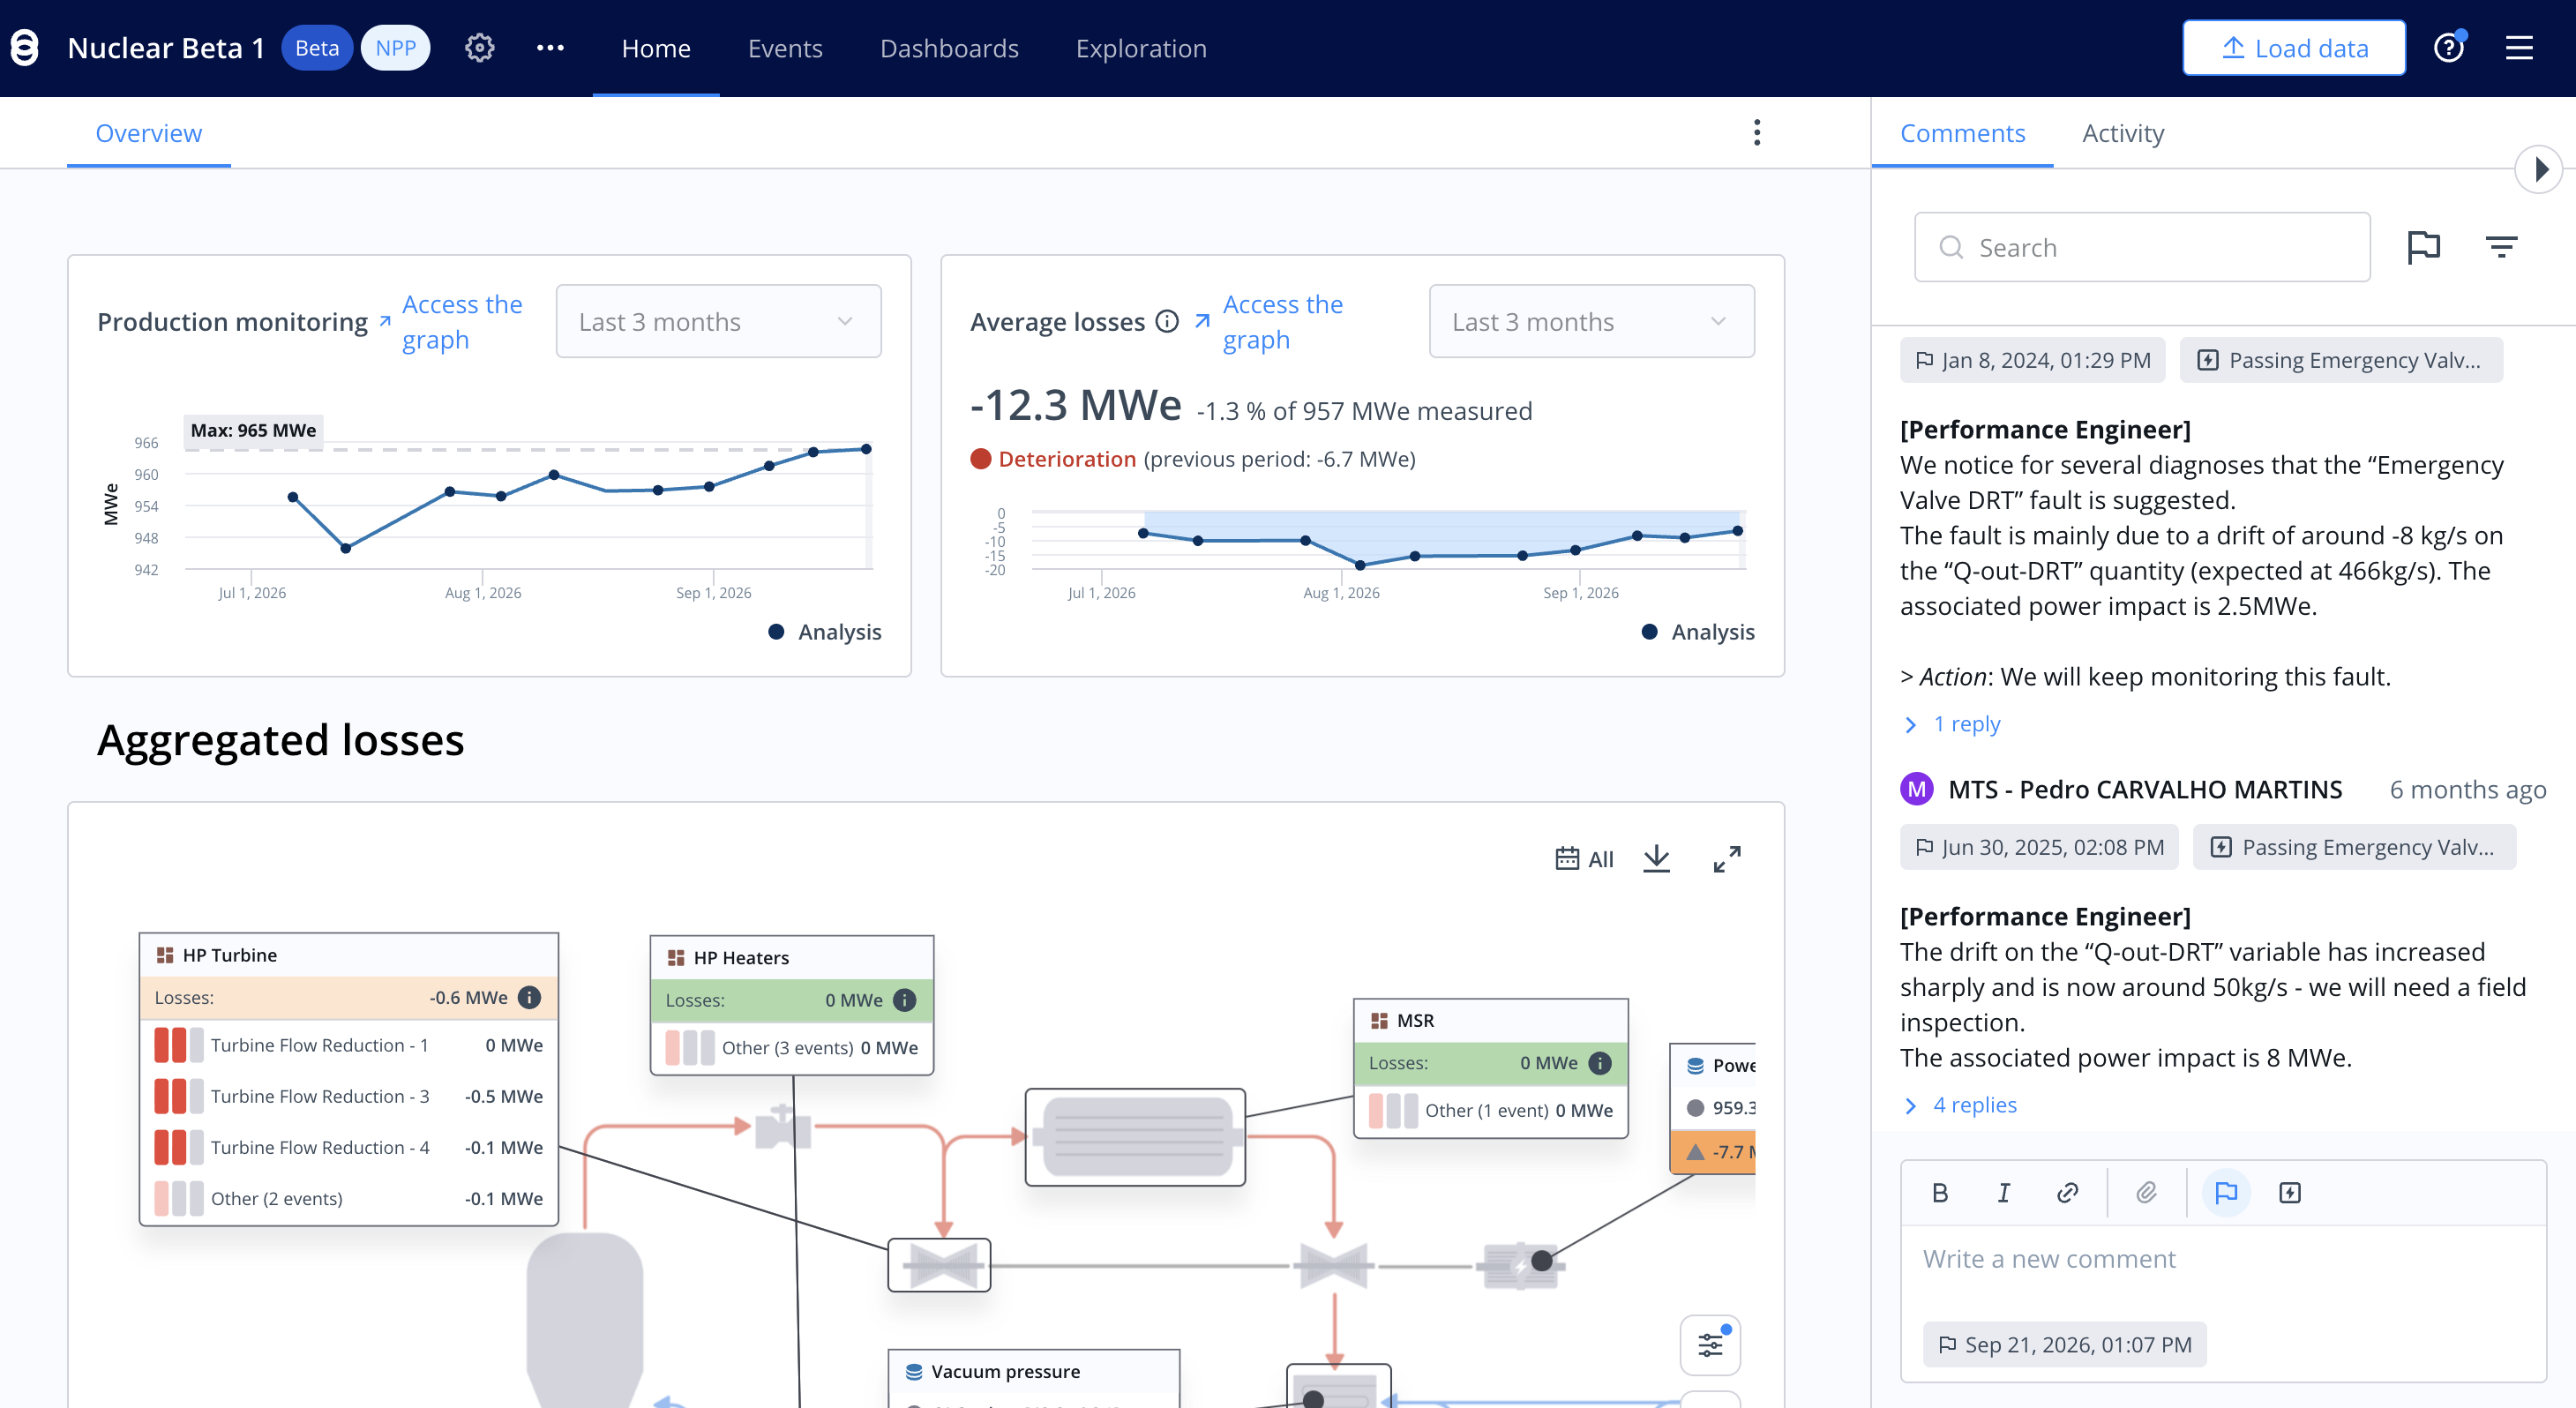
Locate affected systems and see how individual faults contribute to the overall performance gap.
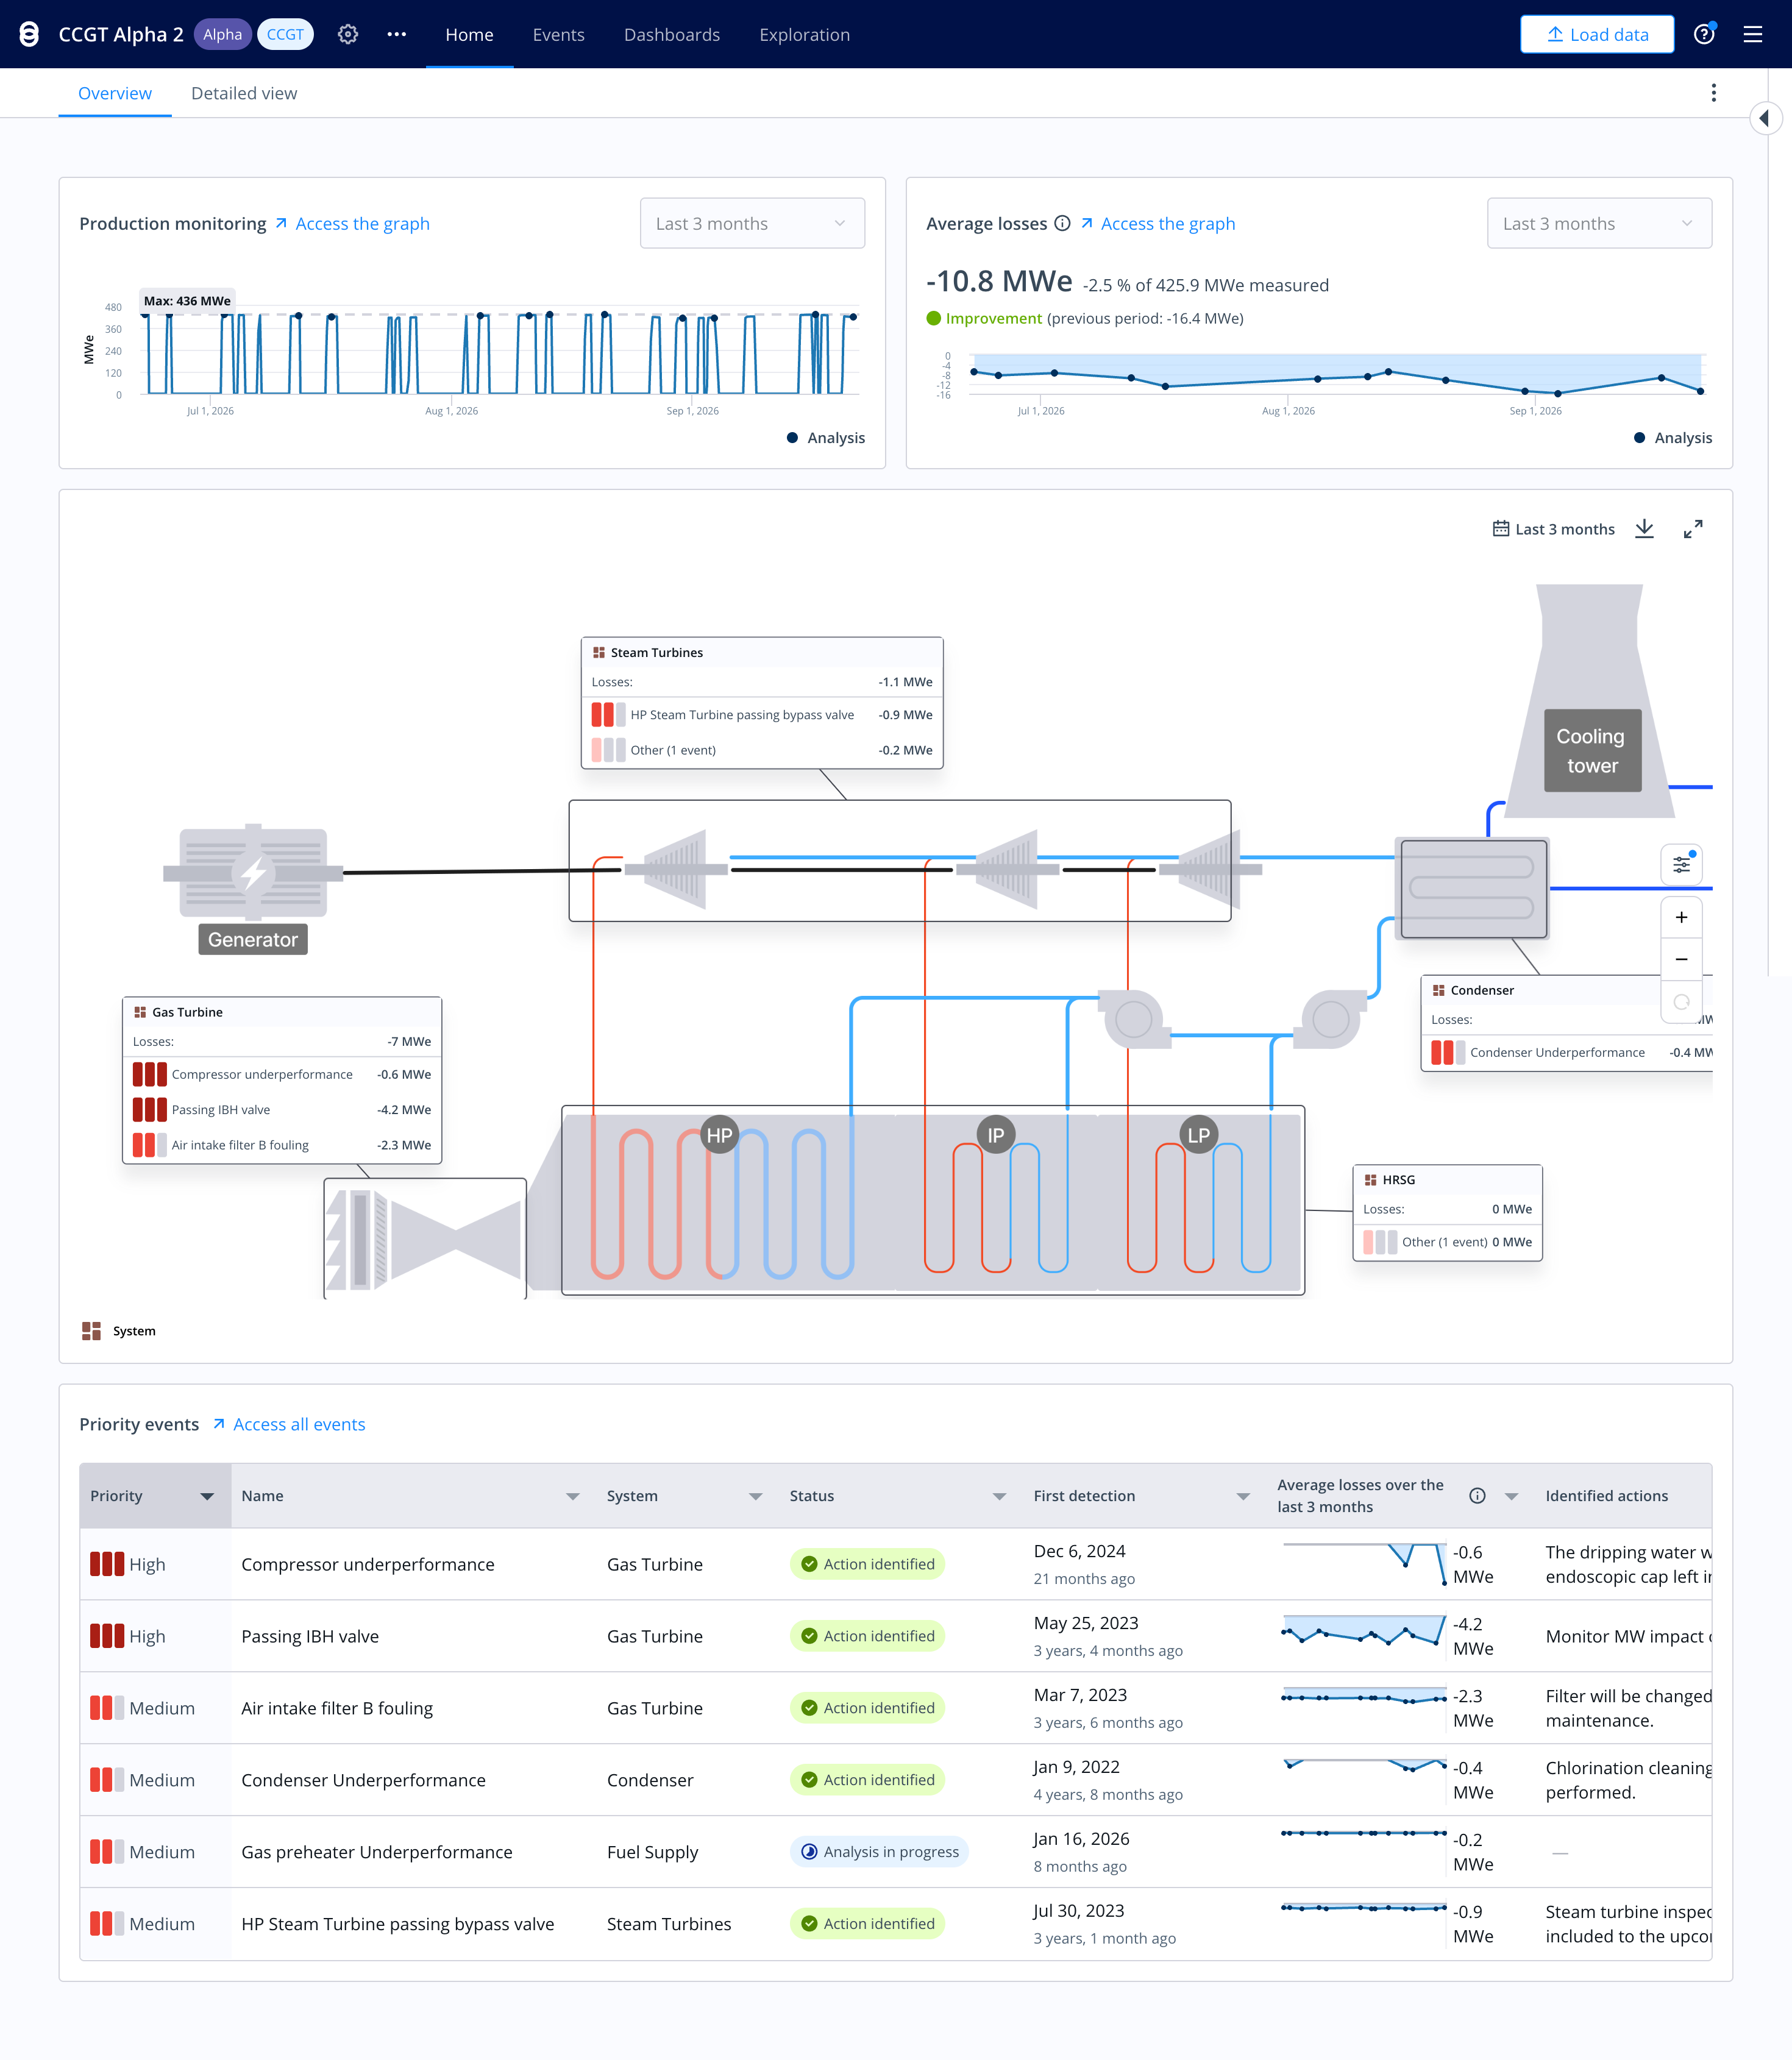
Metroscope combines thermodynamic Digital Twins with constrained AI to quantify power losses, identify causes, and help teams coordinate resolution actions.

The operational challenge
A clear diagnosis gives performance, operations, and maintenance the same basis for action.
Changing load and operating conditions make the performance gap hard to quantify.
Concurrent faults can affect the same measurements and obscure each other.
Teams need to see which faults have the greatest impact before planning action.
Why Metroscope
Locate affected systems and see how individual faults contribute to the overall performance gap.
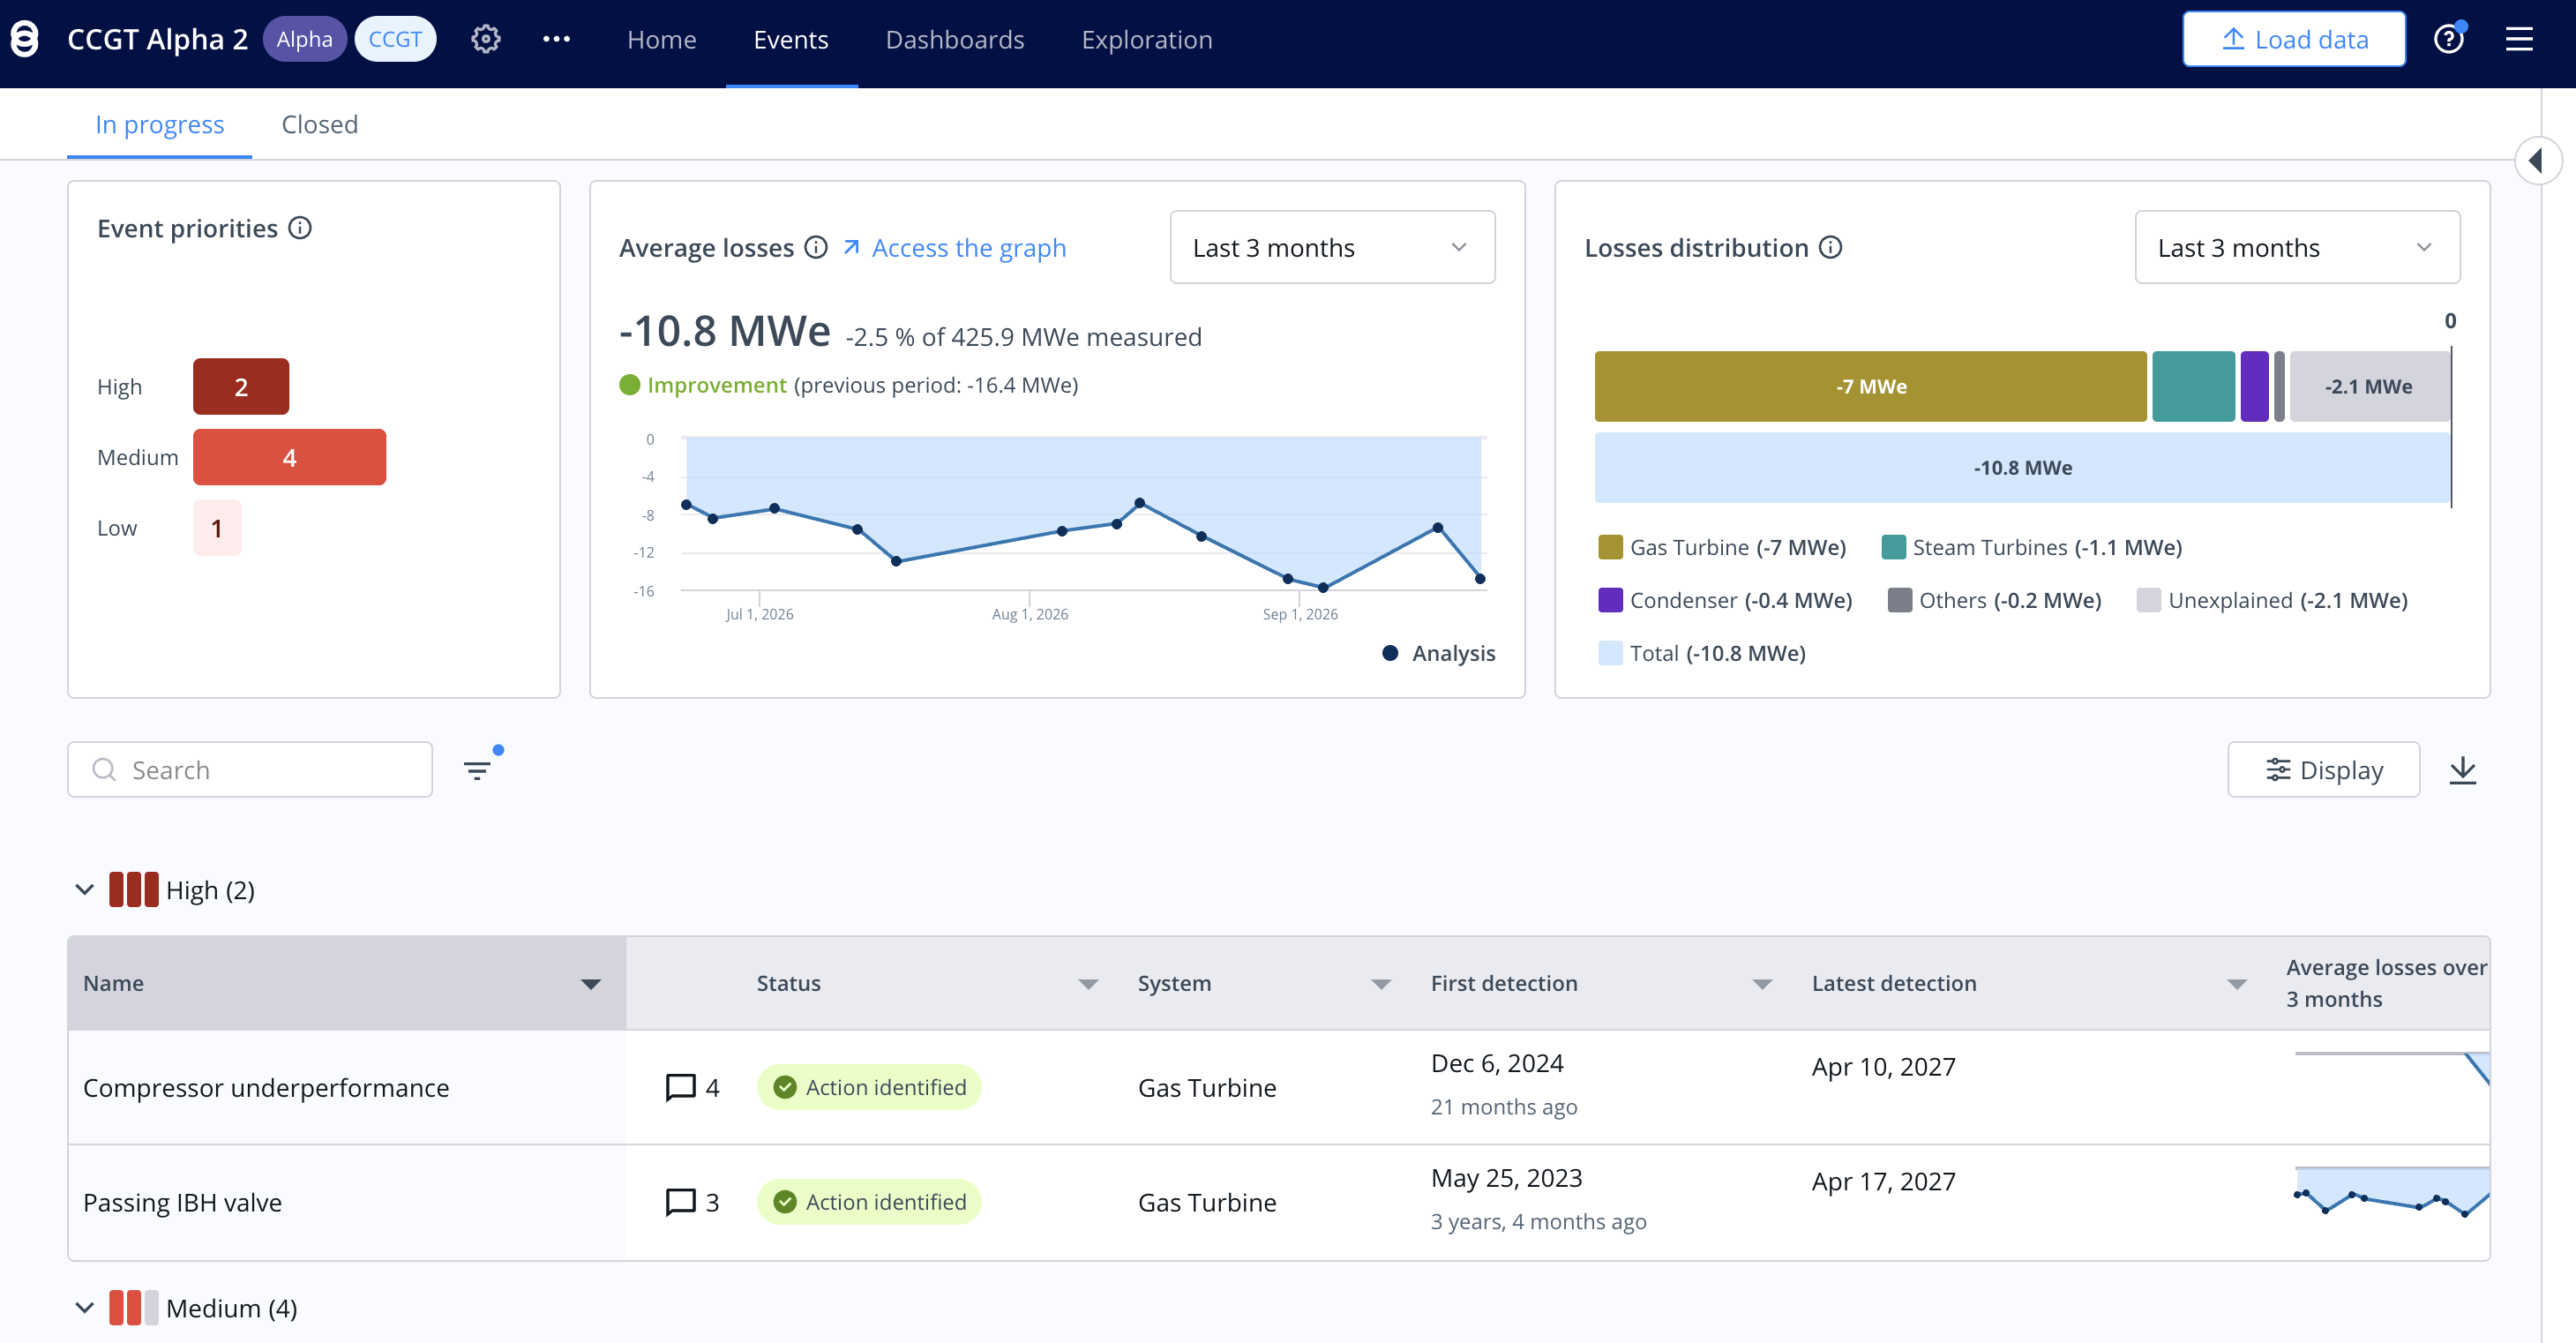
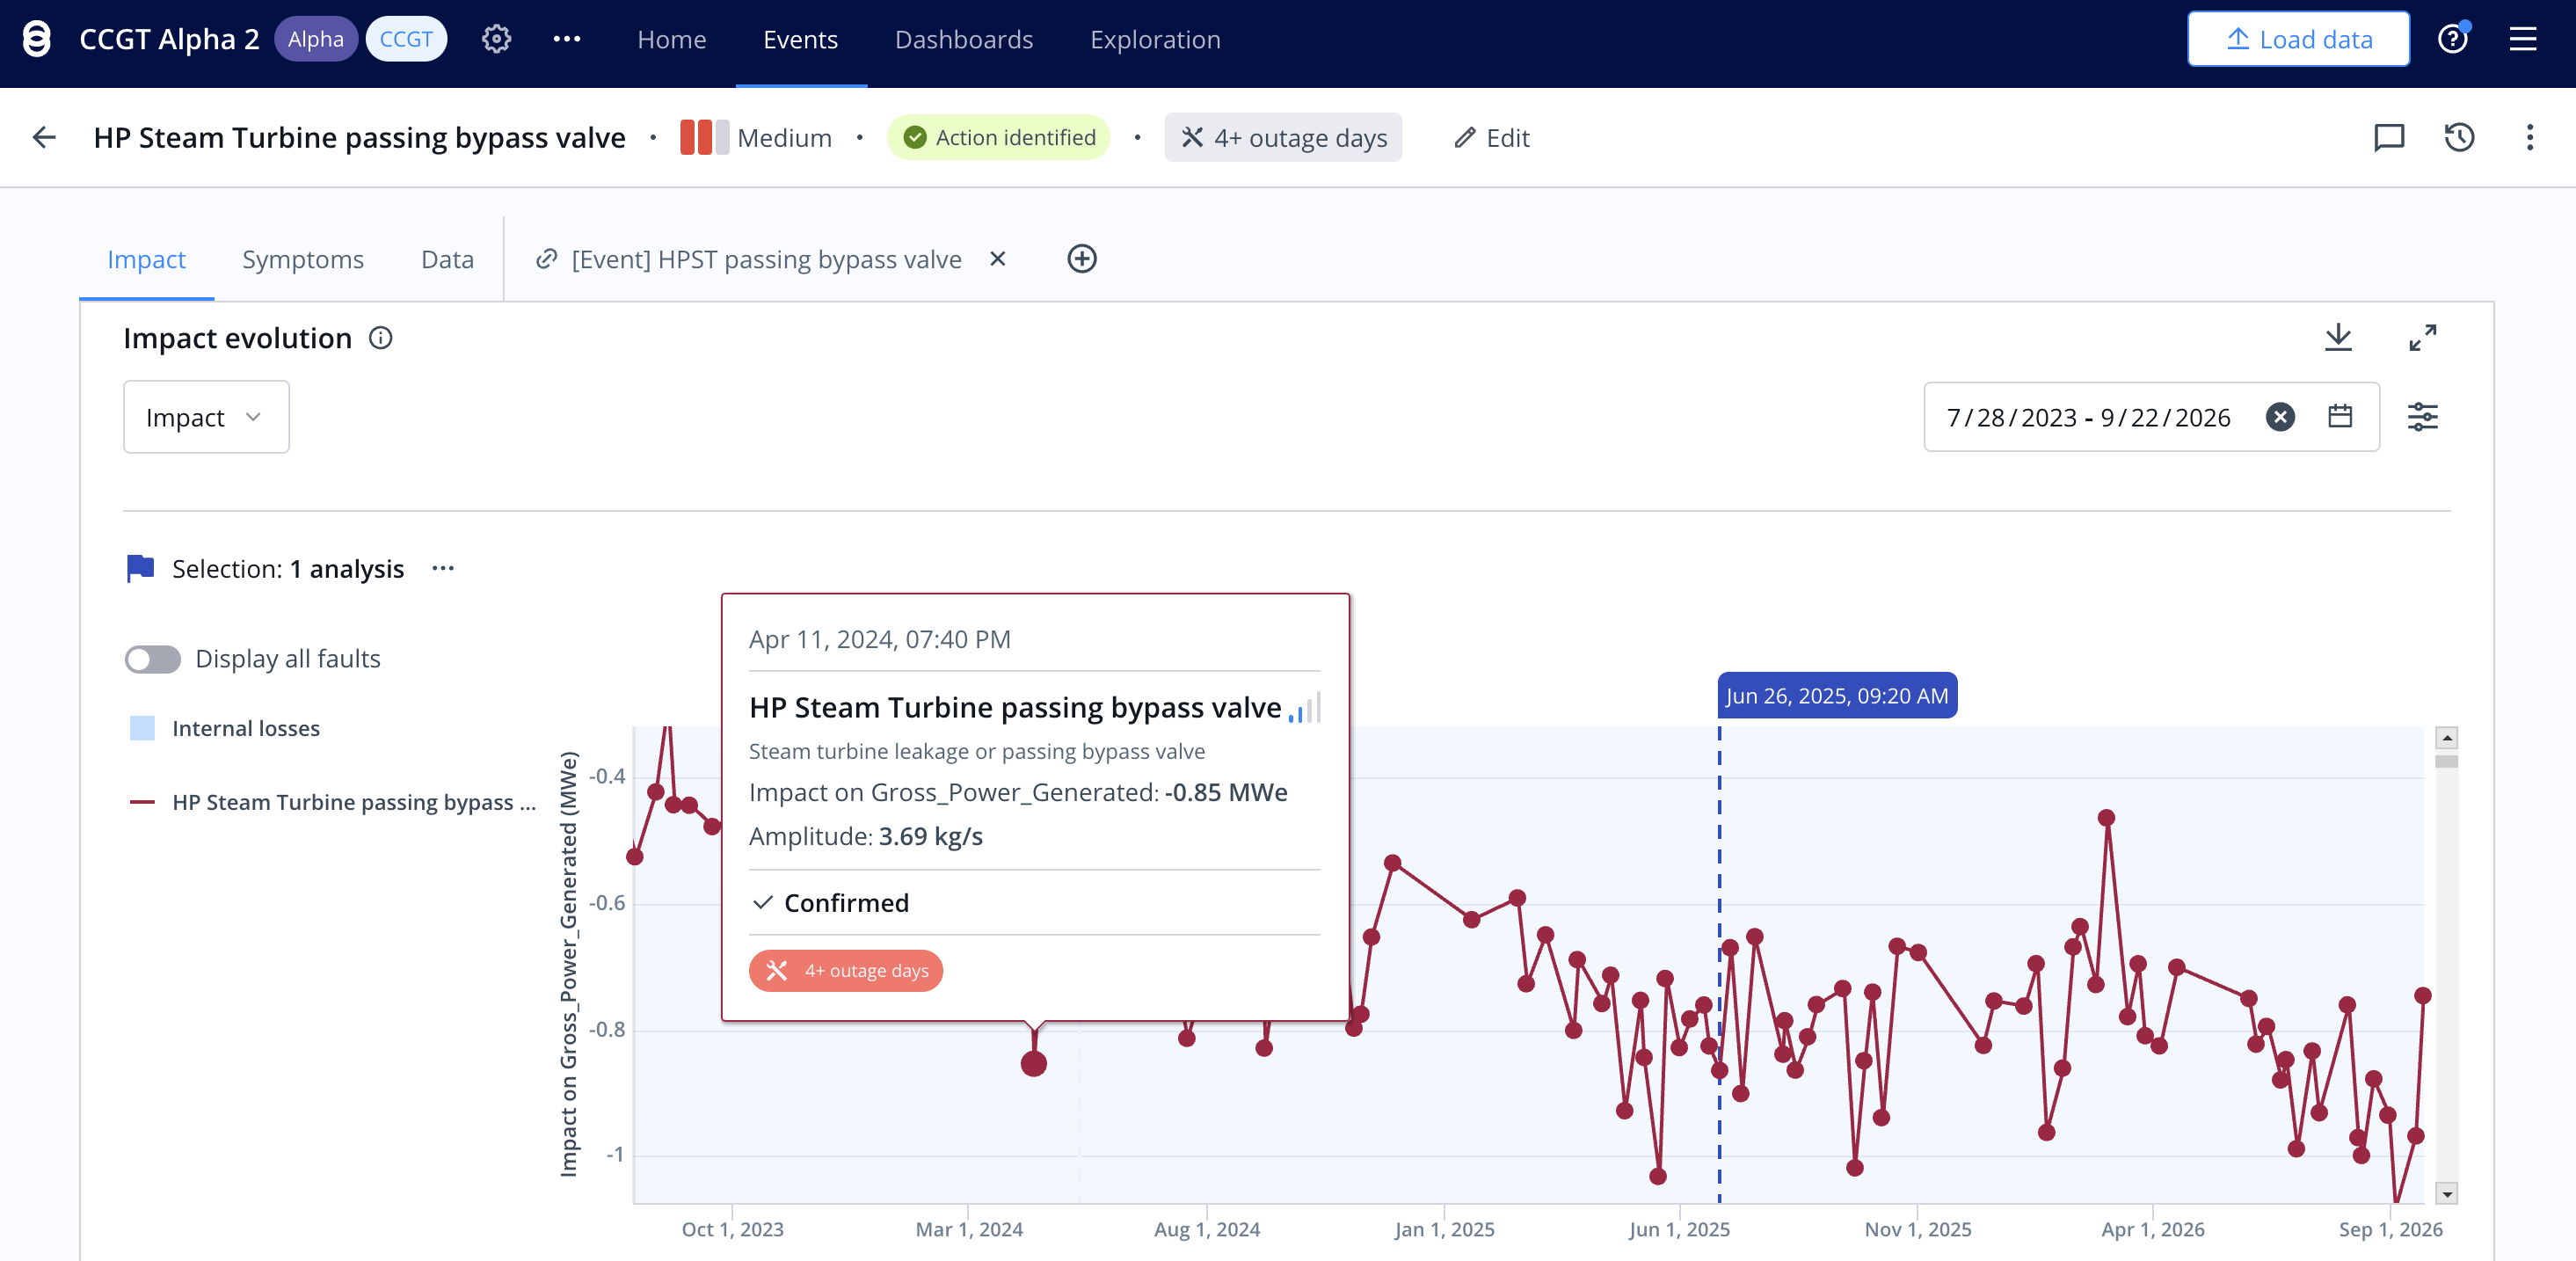
Review events by priority and status, with their detection history and associated losses.
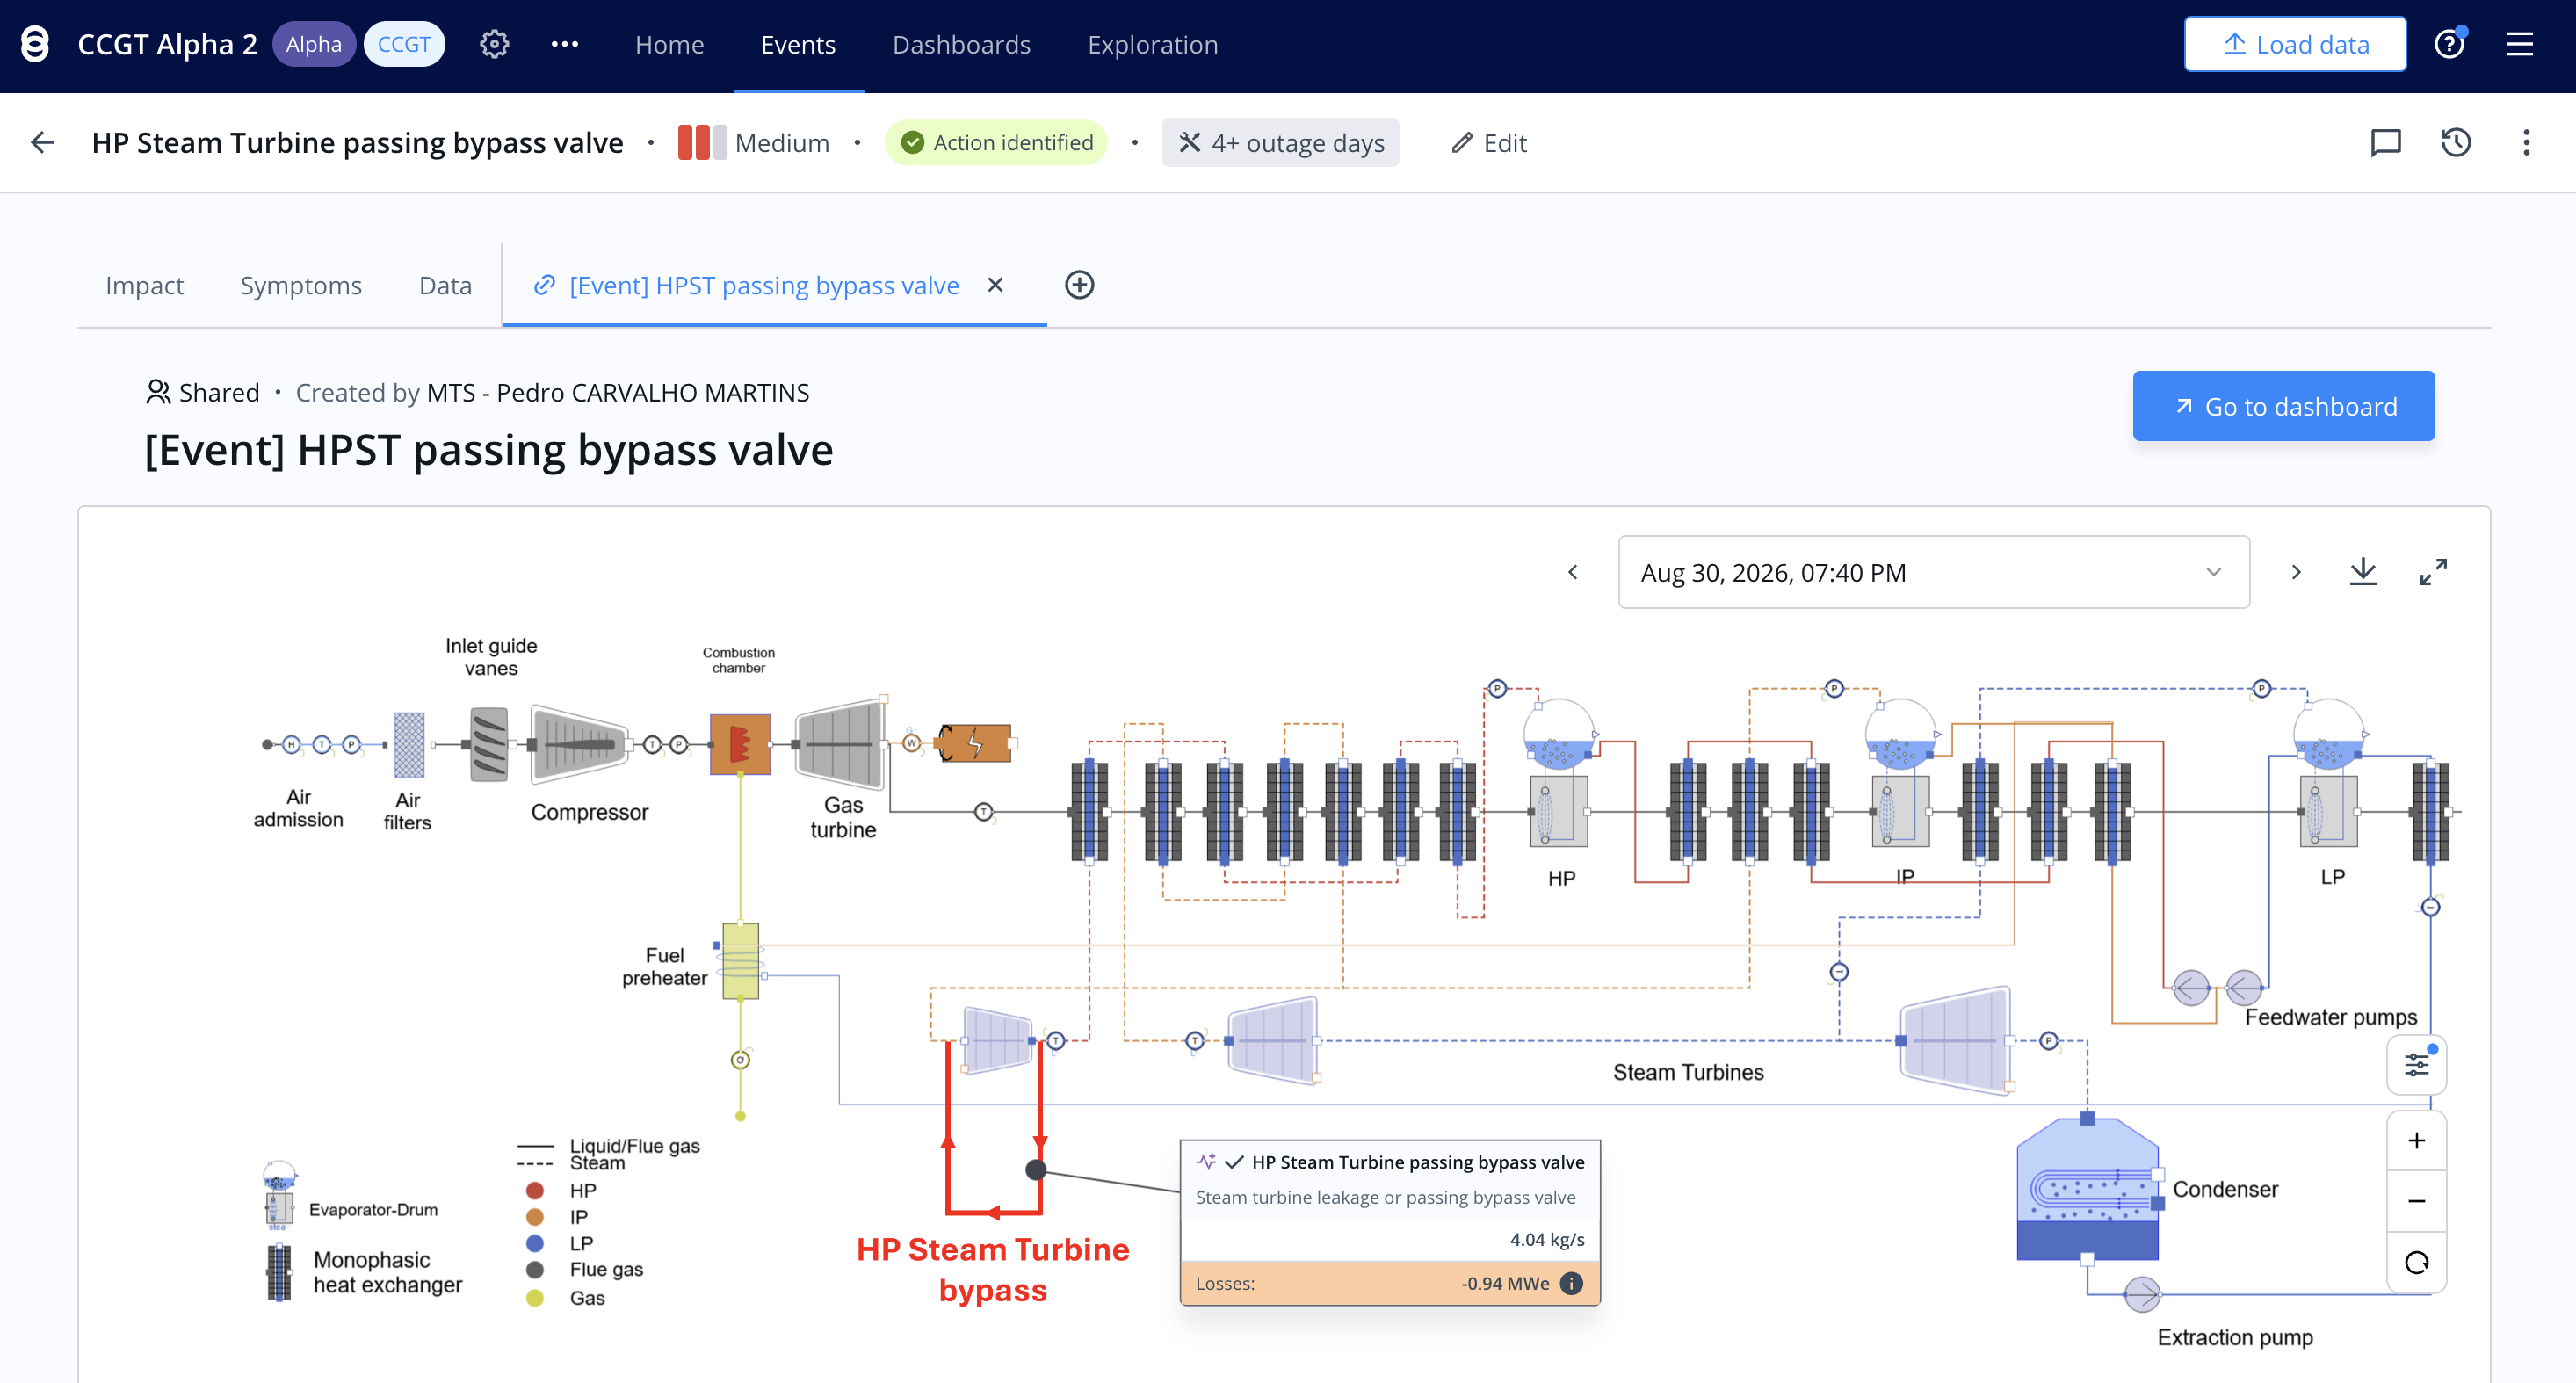
Locate the diagnosed fault in the process, compare measured and expected behavior, and review how symptoms developed to guide site checks.
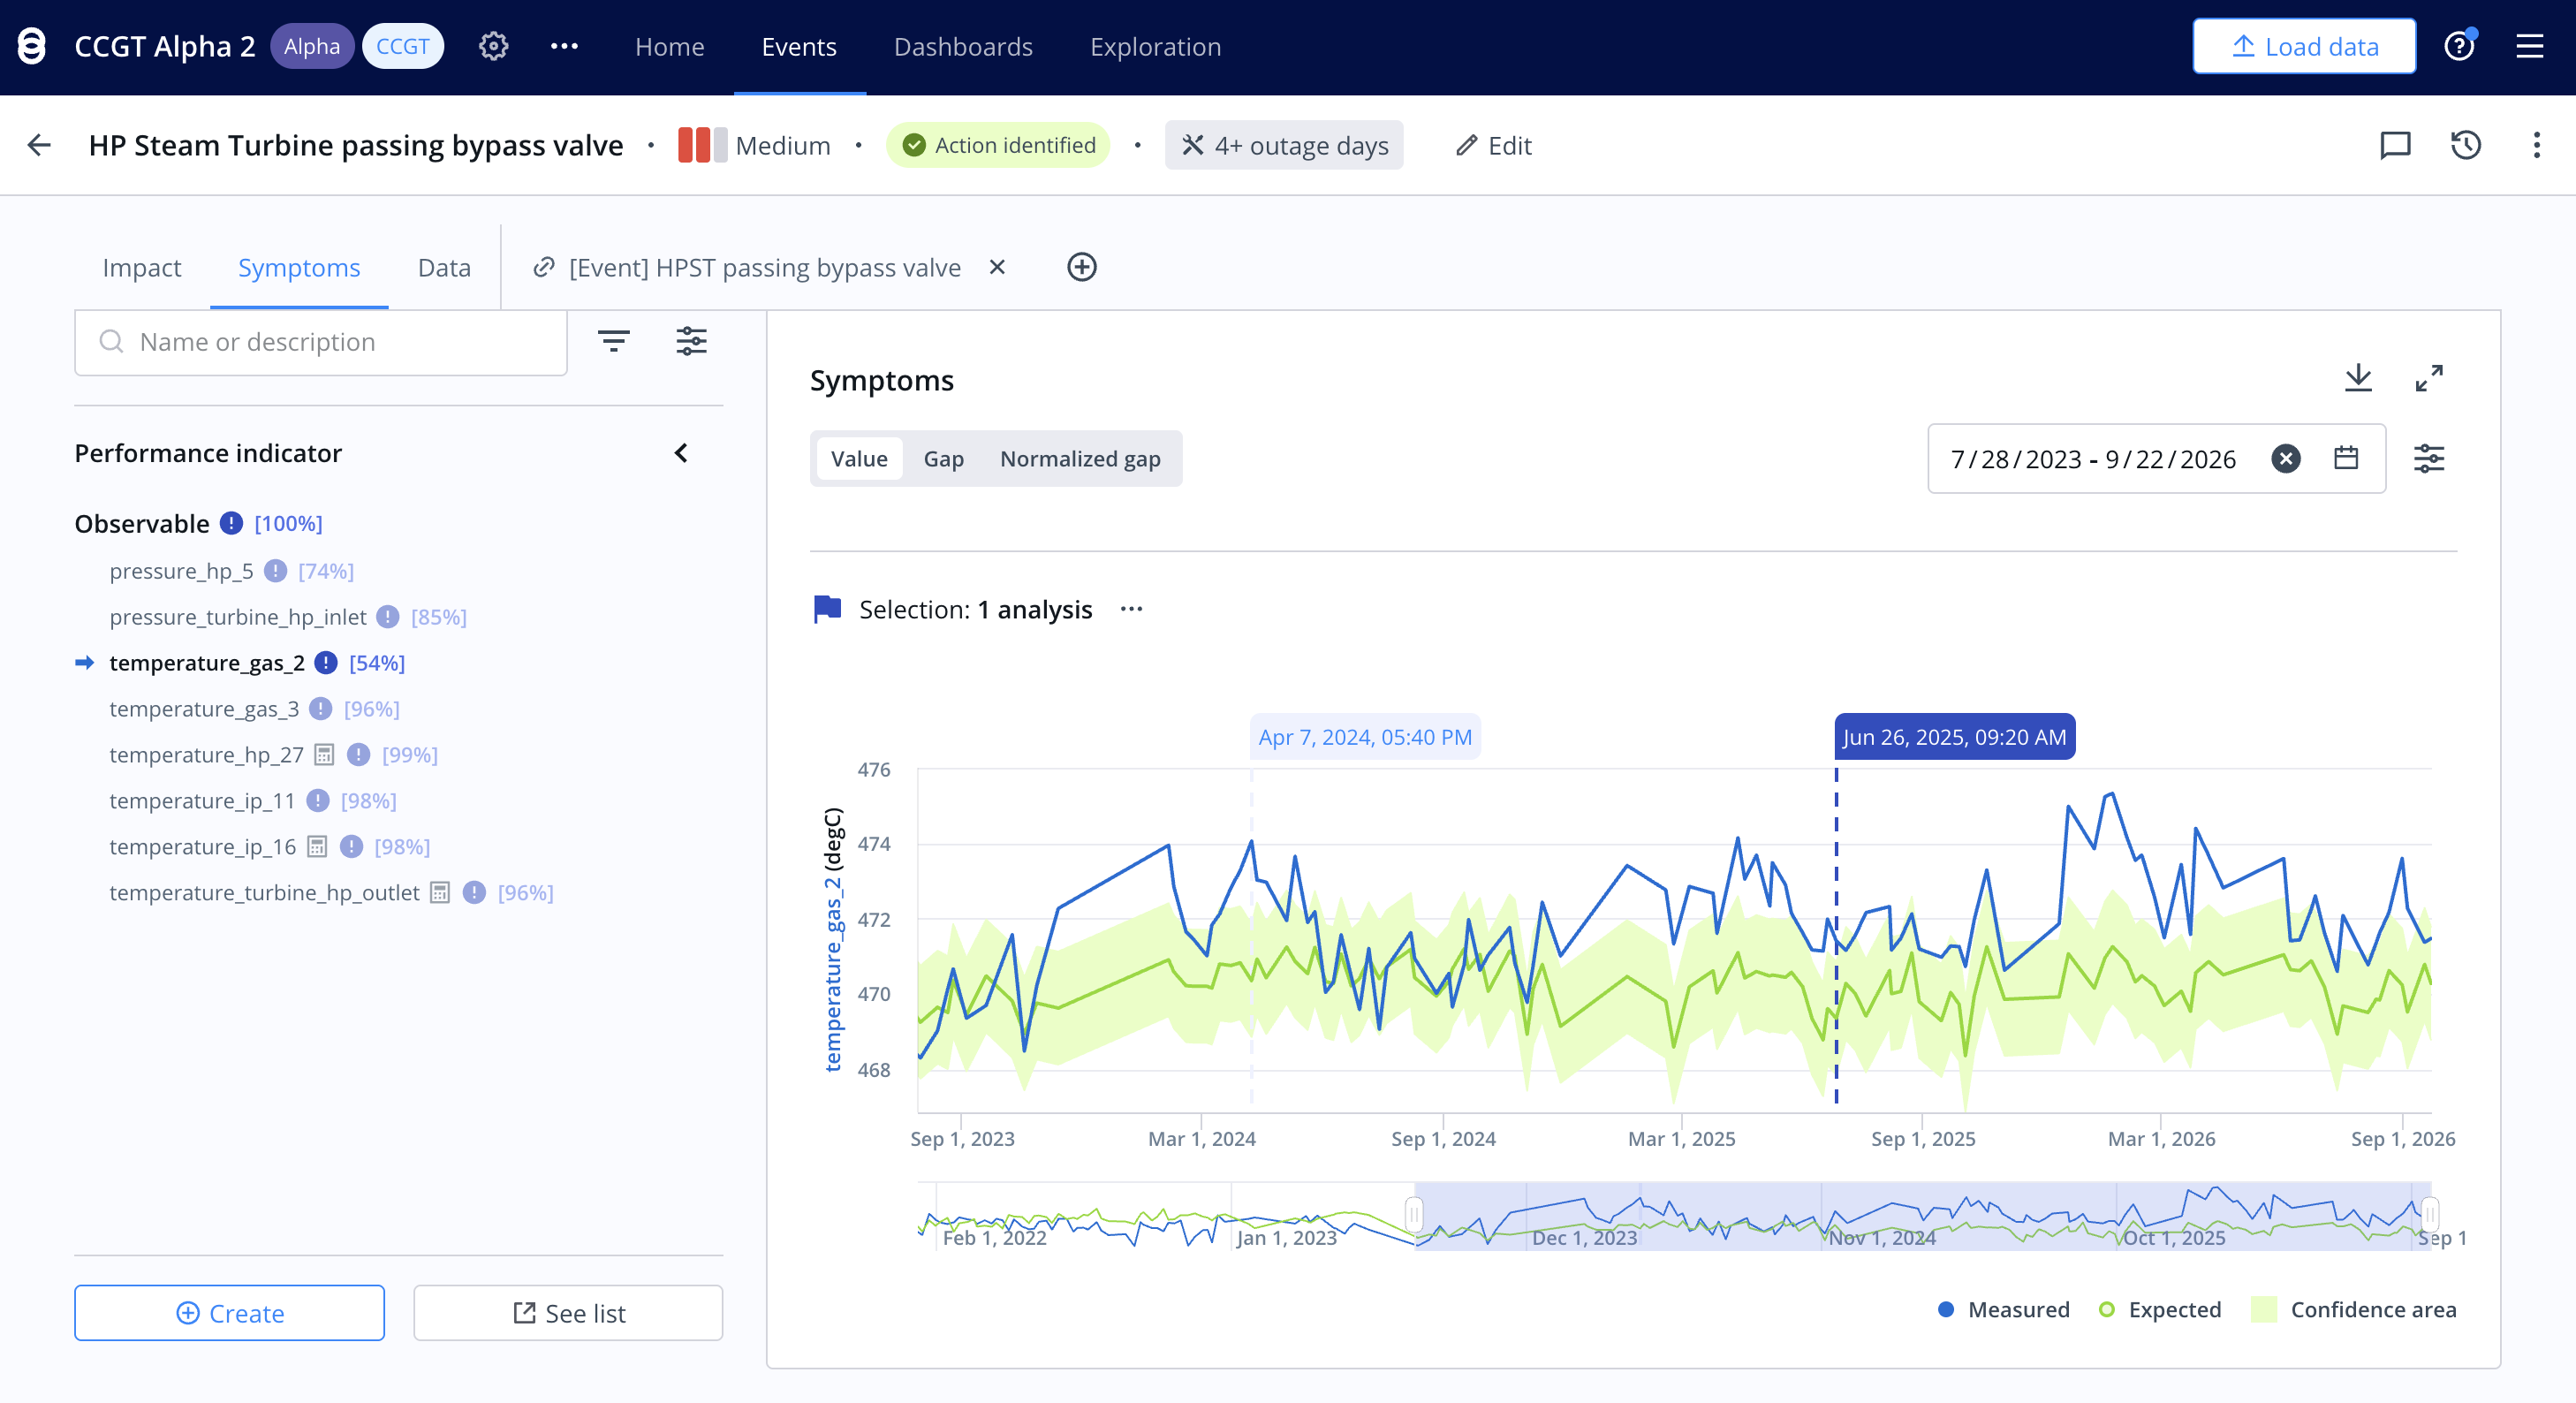
Track fault evolution, share site findings and action status, and assess performance recovery after maintenance.
How Diagnostics works
Diagnostics combines sensor data with a thermodynamic Digital Twin of your process. Differences between measured and expected behavior form symptoms, which the inferential engine uses to identify the most likely faults and quantify their impact on power output.
Our modeling team builds a numerical replica of your process. The Digital Twin simulates how the process behaves and how faults change sensor readings and power output.
The inferential engine uses a probabilistic approach to interpret the observed symptoms. It identifies the most likely combination of simultaneous faults, estimates each fault’s magnitude, and quantifies its impact on power output.
Testimony and use case
“Metroscope clearly identified a moisture separator reheater (MSR) tube rupture and quantified its impact, helping the Axpo team act quickly.”

Daniel Schupp
Thermal Performance Engineer, Axpo
Combined sensor deviations pointed to a passing HP bypass valve, with an estimated impact of 1 MW.
Delivery and support
A plant-specific model, practical training, and support for the investigations that follow.
Metroscope builds the diagnostic model for your plant and validates it with operating context.
Your team is trained to read diagnostic findings and use the model in daily work.
Metroscope helps interpret results as your team reviews findings and plans its response.
Provides operating context, checks findings on site, and decides on maintenance actions.
Builds and validates the model, trains users, and supports interpretation of the results.
Anomaly Detection
Monitor system reliability by detecting and investigating abnormal equipment behavior.
See moduleTransient Monitoring
Automatically detect emerging issues during transient phases and support flexible operations.
See moduleCapacity Forecast
Forecast available power and associated heat rate based on plant and weather conditions.
See moduleBring greater clarity to your next maintenance decision